Market and Economic Outlook - Released 6/30/22
Key takeaways
- The direction of financial markets for the remainder of the year is likely to be related to the Fed’s efforts to control inflation.
- With steady earnings estimates, and lower multiples, the forward 12 month’s P/E for the S&P 500 is trading below 25-year averages and does look attractive if earnings meet expectations.
- High quality core bonds are better positioned today to provide downside protection due to the higher income payments they now provide.
Whether you are at your local grocery store, filling up your car for a weekend road trip or watching the financial news, it is hard to avoid experiencing or hearing about inflation these days. For much of the last 40 years, inflation has not had much of an impact on our daily lives. Looking back at history, we know what a nuisance it can be.
German economist Karl Otto Poehl once surmised “Inflation is like toothpaste, once it is out you can hardly get it back in again.” The Federal Reserve is certainly feeling the pressure to control inflation and put it back to pre-COVID levels. During the late 1970s, in the depths of an economic malaise, Ronald Reagan warned “Inflation is as violent as a mugger, as frightening as an armed robber and as deadly as a hit man.” Regan’s imagery was certainly exaggerated, but it’s hard to deny the negative effects inflation had during the late 1970s and early 1980s, the last time inflation readings reached these levels. Entertainer Will Rogers joked, “Invest in inflation. It's the only thing going up!” Will Rogers’ quip certainly seems to be applicable to investors so far this year as almost every asset class has a negative return with inflation readings setting record highs (Figure 1).
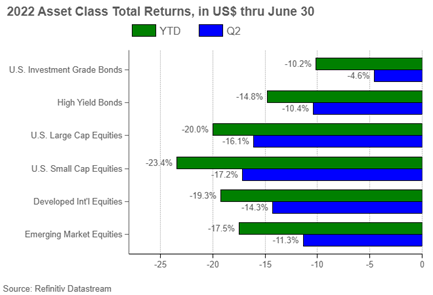 Figure 1
First, let’s take a quick step back and look at where we have come from since the beginning of 2020, before the pandemic. The market peaked on February 19th, 2020. We have discussed how the market dropped quickly and bottomed on March 23rd, 2020, before beginning its very strong recovery throughout 2021. Since then, the market has corrected itself. Where is the S&P 500 now in relation to that prior peak in 2020? On February 19th, 2020, the S&P closed at 3,386. As of 6/30, the S&P 500 closed at 3,785.38. When including reinvested dividends, this equates to a total return of 6.5% annualized (Figure 2). Looking at our expected returns for stocks (Figure 7), this return level is well within the range that we would expect. Perhaps a sign that the market simply got ahead of itself.
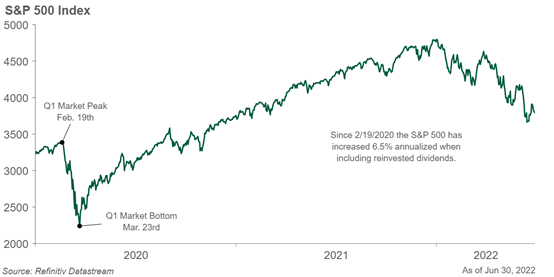 Figure 2
Our Take on Inflation
Inflation remains the key risk impacting market sentiment. We wrote in May rising rates, due to elevated inflation readings, have caused investors to adjust their expectations for market returns going forward. This re-rating has led to a volatile decline in stock and bond prices. The direction of the markets for the remainder of the year is likely to be related to the Fed’s efforts to control inflation.
The groundwork has been laid by the Fed to do just that, but they are in a difficult situation. Many factors like energy prices and supply chain breakdowns are out of their control. The Fed must try to lower demand and, in doing so, may be forced to create a path towards a recession. The stock market is a leading indicator of where the economy is headed (not where it is currently at) and seems to be pricing in a better chance recession may be on the horizon.
Monetary policy works with a lagged effect. A soft landing (which would avoid a recession) is possible, but the Fed will need supply conditions to improve. As the Fed works to fight inflation, it will be challenging to avoid driving the US into a recession and engineering a soft landing is becoming increasingly unlikely. The conflict in Ukraine and elevated demand is causing high oil and gas prices which is exacerbating inflation as oil and gas are used as inputs in many goods. The objective of the Fed hitting their 2% inflation target will take time to achieve. Food and gas prices along with prices for services are not expected to fall anytime soon even if durable goods prices have started to moderate.
If supply chains do improve, the supply demand imbalance can be corrected. Increasing the supply of goods should help reduce the cost to consumers. This would allow the Fed to not keep raising rates (or at least not as aggressively) to reduce demand and have a better chance at engineering a softer landing for the economy.
The economy is still expected to grow despite a negative GDP reading during the first quarter which was related to greater amounts of imports. Economic data points are steady today, but the lag effect of higher interest rates and energy prices is likely to impact consumer spending with retail sales data showing some weakness and consumer confidence coming down. Mortgage rates have jumped higher this year greatly impacting housing affordability. A market pullback leads to shrinking 401(k) balances and a negative wealth effect. Another emerging sign of a weakening consumer is increased use of debt. If the consumer is weakening, the Fed may not have to aggressively raise rates during the rest of the year.
Corporate profitability will continue to come under pressure due to rising input costs. We have concerns over the consumer’s ability to withstand higher prices and how well they are positioned for a sustained inflationary period. We will continue to monitor the inflation data and its potential impacts on financial markets, consumers, and the economic outlook. Looking at U.S. consumer inflation expectations over the five-year period that begins five years from today, investors believe the Fed will get inflation under control over the long term (Figure 3).
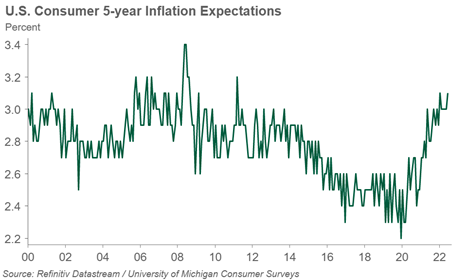 Figure 3
Labor Market Strength
The labor market remains strong although some companies have indicated they are rethinking their hiring plans or reducing their workforce. It’s hard to imagine a recession where everyone has a job. Fed Chair Powell has noted that an increase in the unemployment rate is a possibility while trying to produce a soft-ish landing. Unemployment remains below 4%, however, initial applications for unemployment are slowly trending up (Figure 4).
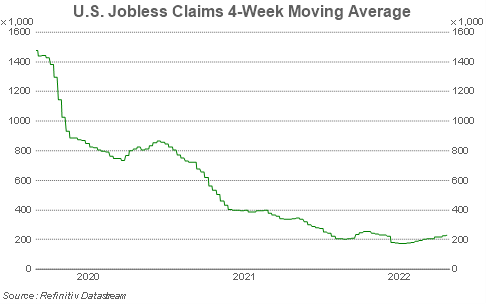 Figure 4
Stock Market Valuations Fall
There has been turmoil in stock markets around the world so far this year which already includes the S&P 500 selling off nearly 25% when it hit its year-to-date low in mid-June, which is well into bear market territory. Earnings growth forecasts currently paint a much different story than stock prices seem to be as we have seen positive earnings growth so far this year. Consensus earnings estimates for the remainder of 2022 and 2023 are no longer rising but have held up well despite the economic uncertainty and negative headlines. As a result, the contributing factor to negative market returns this year is falling multiples in the price-to-earnings (P/E) ratio for the S&P 500 (Figure 5). This means that investors in general are willing to pay less per dollar of earnings than during times when multiples are higher which may project investor pessimism in the market going forward.
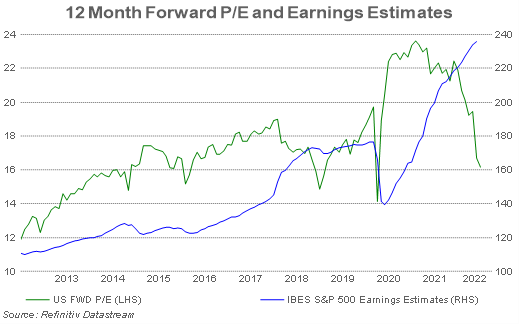 Figure 5
The current market pullback, however, has removed some of the valuation excesses that appeared, especially in many growth stocks, since the recovery from the March 2020 lows. We believe this is somewhat justified given the uncertainty of the near-term economic environment. With steady earnings estimates, and lower multiples, the forward 12 month’s P/E for the S&P 500 is trading below 25-year averages and does look attractive, but the key question for investors is if corporate earnings will continue to meet these lofty expectations. The risks of negative earnings revisions appear to be rising, as we have seen retailers issue dire forecasts about a slowing consumer, lower profit margins due to rising inventories, and greater cost pressures due to inflation. If earnings are unable to meet expectations, we could see further selling pressure on stocks.
Since 1942, the average bear market for the S&P 500 has lasted roughly 12 months with the average selloff leading to a 32% decline. Meanwhile, investors who remained invested at the start of the recovery (measured from the lowest close during the cycle) experienced a roughly 4.5-year bull market averaging a 154% cumulative total return (Source: First Trust). These of course are averages, and every market cycle has its own unique factors and magnitudes, but we believe this demonstrates that investors, for whom taking risk in stocks is appropriate, will be compensated for taking that risk over time.
Despite the uncertainty and negative returns so far this year, we have grown more constructive on stocks going forward. We have raised the high end of the range for our forward 5–10-year return expectations for stocks to 9% while leaving the lower band at 5% (Figure 7). While the range is wider due to the increased uncertainty we are experiencing, historically the S&P 500 has hit its cycle lows prior to the announcement of a recession. In our view, the best buying opportunities often come when it doesn’t feel good to do so.
Bond Yields Move Higher
Interest rates increased during the quarter as the market continued to digest rising inflation data and this led to another negative quarterly return for bond investors. The U.S. Treasury yield curve has moved significantly higher since the end of 2021 (Figure 6). The intermediate portions of the yield curve ended the quarter trading slightly above the yield on the 10-year Treasury. Historically, a yield curve inversion could be signal of a recession on the horizon.
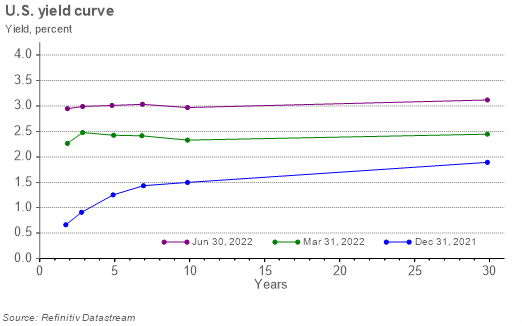 Figure 6
Owning longer maturity bonds has been difficult this year in a rising rate environment but owning these bonds has the potential for greater price appreciation if interest rates stabilize or fall. Investment grade bond yields are at their highest levels relative to recent history due to higher treasury rates and credit spreads widening. The difference between corporate bond yields and Treasury rates has significantly widened this year due to the uncertain economic outlook. However, corporate balance sheets remain in solid shape with interest rate coverage ratios near record highs.
High quality core bonds are better positioned today to provide downside protection due to the higher income payments they now provide. For example, the yield to worst for the Bloomberg Aggregate Bond Index was 3.72% as of 6/30. Bond investors can look forward to the higher income/coupon these assets will generate over the next few years as compared to just 6 months ago. Due to the move higher in interest rates, we are increasing our outlook for future bond returns to 2-4% given the sharp move higher in interest rates (Figure 7).
We believe given elevated risk of recession it makes sense to begin to reduce the allocation to nontraditional income sectors like bank loans, preferred stocks, and emerging markets debt within bond portfolios. These areas add diversification but could have greater downside than investment grade bonds if we experience and economic slowdown which leads to a recession.
It is important for fixed income investors to keep a long-term perspective. Our research shows the Bloomberg Aggregate Bond Index has not had a negative nominal return over any rolling 5-year period since the inception of the index in 1976. For clients with a 5-year time horizon or longer, it is highly unlikely to have a negative nominal return in bonds over 5 years as it has never happened. If your time horizon is less than 5 years you may consider other options with less interest rate risk to meet your investment objective.
The Bottom Line
Unfortunately, inflation will continue to have an impact for the remainder of 2022. Many clients are considering making changes to their portfolio due to the market volatility. We don’t feel it makes sense to try to time this inflationary cycle by making major changes to your asset allocation or portfolio holdings. Staying the course is the best action unless your long-term financial plan has changed. We feel client portfolios are positioned for an inflationary environment but will adjust as needed. Uncertainty remains high but we feel the investment climate looking forward is more attractive today than it was late last year.
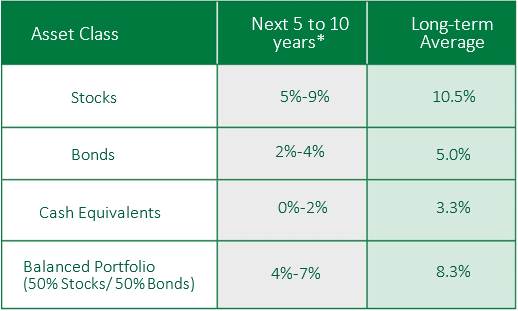 Figure 7
COUNTRY Trust Bank® Wealth Management Team
- Troy Frerichs, CFA - VP, Investment Services
- Jeff Hank, CFA, CFP® - Manager, Wealth Management
- G. Ryan Hypke, CFA, CFP® - Portfolio Manager
- Weston Chenoweth - Investment Analyst
- Beau Lartz - Investment Analyst
- Chelsie Moore, CFA, CFP® - Director, Wealth Management & Financial Planning
- Kent Anderson, CFA - Portfolio Manager
- Jonathan Strok, CFA - Portfolio Manager
- Jamie Czesak - Investment Analyst
- Cody Behrens - Investment Analyst
Looking for help navigating your future?
Set up a meeting with your local rep to review your current policies and make sure they're up to date. We pulled together some less obvious reasons to adjust your coverage.
COUNTRY Financial® is a family of affiliated companies (collectively, COUNTRY) located in Bloomington, IL. Learn more about who we are.
*Forecasted average annual returns of COUNTRY Trust Bank Wealth Management
Source: Morningstar and COUNTRY Trust Bank® - See Definitions and Important Information below
NOT FDIC-INSURED
May lose value
No bank guarantee
All information is as of the report date unless otherwise noted.
This material is provided for informational purposes only and should not be used or construed as investment advice or a recommendation of any security, sector, or investment strategy. All views expressed and forward-looking information, including forecasts and estimates, are based on the information available at the time of writing, do not provide a complete analysis of every material fact, and may change based on market or other conditions. Statements of fact are from sources considered reliable, but no representation or warranty is made as to their completeness or accuracy. Unless otherwise noted, the analysis and opinions provided are those of the COUNTRY Trust Bank investment team identified above and not necessarily those of COUNTRY Trust Bank or its affiliates.
Diversification, asset allocation and rebalancing do not assure a profit or guarantee against loss. All market indexes are unmanaged, and returns do not include fees and expenses associated with investing in securities. It is not possible to invest directly in an index.
Investment management, retirement, trust and planning services provided by COUNTRY Trust Bank®.
Past performance does not guarantee future results. All investing involves risk, including risk of loss.
Definitions and Important Information
Figures 1,2,3,4,5,6: Chart data comes from Refinitiv (formerly Thomson Reuters) DataStream, a powerful platform that integrates top-down macroeconomic research and bottom-up fundamental analysis.
Figure 7: The long-term average return data comes from Morningstar and is based upon compound average annual returns for the period from 1926 through December 31, 2021 Stocks are represented by the Ibbotson® Large Company Stock Index, which is comprised of the S&P 500® Composite Index from 1957 to present, and the S&P 90® Index from 1926 to 1956. Bonds are represented by the Ibbotson® U.S. Intermediate-Term Government Bond Index. Cash Equivalents are represented by the 30-day U.S. Treasury bill. The “Balanced Portfolio” is representative of an investment of 50% stocks and 50% bonds rebalanced annually. Forecasted stock returns include small capitalization and international equities. Forecasted bond returns include investment grade corporate bonds. These returns are for illustrative purposes and not indicative of actual portfolio performance. It is not possible to invest directly in an index.
The S&P 500® Index is an unmanaged index consisting of 500 large-cap U.S. stocks. Since it includes a significant portion of the total value of the market, it also considered representative of the market. The index does not reflect investment management fees, brokerage commission and other expenses associated with investing in equity securities. It is not possible to invest directly in an index.
Stocks of small-capitalization companies involve substantial risk. These stocks historically have experienced greater price volatility than stocks of larger companies, and they may be expected to do so in the future.
GDP or Gross Domestic Product is the monetary value of all goods and services produced during a specified period. The figure is used as a barometer of an economy’s health including its size and growth rate. In the U.S., quarterly GDP figures are typically “annualized” meaning the quarterly growth is compounded for four quarters.
The Bloomberg U.S. Aggregate Bond Index is an unmanaged index that covers the USD-denominated, investment-grade, fixed rate, taxable bond market of securities. The Index includes bonds from the Treasury, Government-Related, Corporate, MBS, ABS, and CMBS sectors.
The yield to worst (YTW) can be defined as the minimum yield that can be received on a bond, assuming the issuer doesn’t default on any of its payments. YTW particularly makes sense for bonds where the issuer exercises its options like calls, prepayments, or sinking funds.
A basis point is equal to one hundredth of one percent. It is used chiefly in expressing differences in interest rates.
The yield curve plots the interest rates of similar-quality bonds against their maturities. The most common yield curve plots the yields of U.S. Treasury securities for various maturities. An inverted yield curve occurs when short-term rates are higher than long-term rates.
The 5-Year, 5-Year Forward Inflation Expectation is a measure of expected inflation (on average) over the five-year period that begins five years from today.
The federal funds rate is the interest rate at which depository institutions lend reserve balances to other depository institutions overnight. The Federal Open Market Committee, which is the primary monetary policymaking body of the Federal Reserve, sets its desired target range
The price-to-earnings ratio is a valuation ratio which compares a company's current share price with its earnings per share (EPS). EPS is usually from the last four quarters (trailing P/E), but sometimes it can be derived from the estimates of earnings expected in the next four quarters (projected or forward P/E). The ratio is also sometimes known as "price multiple" or "earnings multiple."
The interest rate coverage ratio is a debt and profitability ratio used to determine how easily a company can pay interest on its outstanding debt. The interest coverage ratio is calculated by dividing a company's earnings before interest and taxes (EBIT) by its interest expense during a given period.
The Consumer Price Index (CPI) measures the average change in prices over time that consumers pay for a basket of goods and services. Core CPI is the CPI subtracting energy and food prices.
The Morgan Stanley Capital International All Country World Index Ex-U.S. (MSCI ACWI Ex-U.S.) is a market-capitalization-weighted index maintained by Morgan Stanley Capital International (MSCI). It is designed to provide a broad measure of stock performance throughout the world, except for U.S.-based companies. The MSCI ACWI Ex-U.S. includes both developed and emerging markets.
International investing involves risks not typically associated with domestic investing, including risks of adverse currency fluctuations, potential political and economic instability, different accounting standards, limited liquidity and volatile prices.
Fixed income securities are subject to various risks, including changes in interest rates, credit quality, market valuations, liquidity, prepayments, early redemption, corporate events, tax ramifications and other factors. Debt securities typically decrease in value when interest rates rise. The risk is usually greater for longer-term debt securities. Investments in lower-rated and nonrated securities present a greater risk of loss to principal and interest than higher- rated securities.
Source: First Trust Portfolios L.P., Client Resource Kit: Markets in Perspective: Slide 5 “History of U.S. Bear & Bull Markets.” Accessed via email 6/27/2022. www.FTPortfolios.com