Market and Economic Outlook - Released 3/31/22
Key takeaways
- Risks moving forward are certainly higher than they were coming into the year, but some of this has already been reflected in equity prices.
- While the major indexes have rallied back from their lows, earnings growth forecasts for 2022 remain robust in the U.S., which makes stocks look reasonably valued at current levels at least compared to recent highs.
- Rising interest rates have led to negative returns for most types of fixed income investments this year. However, rising rates provide the opportunity to reinvest at higher yields over time which can lead to higher total returns down the road.
Warren Buffett, CEO of Berkshire Hathaway, once gave some simple investment advice, “be fearful when others are greedy, and greedy when others are fearful.” Historically, fear and greed have driven financial markets in the short-term but there appears to be more fear than usual for investors to consider lately. The start of the year has proven to be a bumpy ride with the VIX index, a measure of implied market volatility (also known as the fear gauge), beginning the year below 17 and moving to a high of almost 39 before coming back down into the low 20’s to end the quarter.
We came into the year understanding the risks that new COVID variants posed as well as the impact persistent inflation might have on the economy. While news around COVID remains, and with fresh lockdowns in large port cities in China such as Shanghai and Shenzhen resulting from their zero-covid strategy, it appears inflation concerns have taken the forefront of investors’ minds while COVID has shifted to the background.
Inflation, generally resulting from a supply / demand imbalance, remained on the rise in the first part of the year reaching 7.9% in February. Supply needs to increase, or demand needs to decrease, to control inflation. With continued supply chain disruptions, it is unlikely that balance occurs due to an increase in supply. Therefore, it appears inflation will need to be resolved through a decrease in demand which could end up being reduced by the impacts of higher energy prices or the Fed raising rates (we saw the first-rate increase since 2018 in March).
Geopolitical Disruption
The invasion of Ukraine by Russian forces on February 24th added another significant geopolitical risk for investors to navigate. The conflict between Russia and Ukraine has magnified inflation issues through rising energy and food prices producing inflation data points we haven’t seen in over 40 years.
The Russian invasion has significantly impacted global relations, and the ripple effects created by this event will be difficult to forecast. Long-term impacts of the invasion could lead to changes in energy policy, trade relations and politics for years to come. It may also lead to companies rethinking their supply chains and where and how their materials and components are being sourced. While U.S. companies in total do not have a significant direct exposure to Russia, their suppliers might. Missing even the smallest parts can put a large dent in a company’s operations (look no further than the semiconductor shortage). The supply shock and resulting inflation may lead to lower than forecasted economic growth or even a recession as consumers pare back on spending on goods and services.
While inflation and the Ukraine/Russia conflict have taken the spotlight to start the year, there are some positives that we see across the economy as we move through the year. The labor market is in a very strong position as can be seen by an unemployment rate at 3.8% and 11.3 million job openings. With about 6.27 million people who are unemployed and seeking work, there are about 1.8 job openings per person. We have also seen the participation rate continue to increase through the beginning of the year.
Wages on the Rise
According to the Brookings Institution, household finances are in a better position now than they were in 2019. While inflation will have an impact, households are better positioned to deal with these price increases than they otherwise would have been. Wages have also been increasing. The Federal Reserve Bank of Atlanta’s wage growth tracker shows overall median wage growth over the past 12 months at 4.3% in February with the bottom 25% of earners faring the best at 5.9% growth.
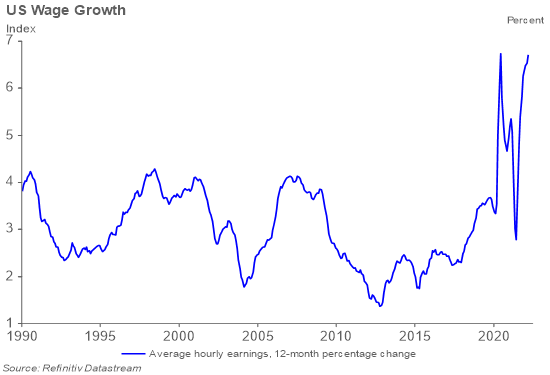 Figure 1
Risks moving forward are certainly higher than they were coming into the year. The outcome of the Ukraine crisis is uncertain. Inflated energy prices could create a situation where we enter a period of stagflation (an environment of persistently high inflation combined with weak demand for goods and services). Some of these risks appear to have been factored into equity prices with U.S. stocks down 5.3% and international stocks down 5.4% year to date through the first quarter. We continue to favor stocks over bonds in the near-term with the pullback we have seen.
Optimistic on Earnings
Certainly, global stock markets were not immune to the bumpy ride during the quarter. The S&P 500 at one point entered correction territory and was down nearly 15% from its highs in early January. While often causing investor unease, as we wrote in February, pullbacks of this magnitude are not uncommon, and by mid-March it appeared that the market had seemingly shrugged off much of what was happening in the world. The tide of the subsequent rally has not necessarily lifted all boats though, as disparity of returns across asset classes still provide pockets of opportunity we are seeking to benefit from.
The correction during the quarter has created an environment where price-to-earnings multiples have fallen, especially in segments of the market like growth stocks due to concerns about rising interest rates. While the major indexes have rallied back from their lows, earnings growth forecasts for 2022 remain robust in the U.S., which makes stocks look reasonably valued at current levels at least compared to recent highs. The S&P 500 is trading at 19x forward 12-month "EPS", which is close to 5-year averages while the Nasdaq, as proxy for growth stocks, is trading at 25x forward 12-month “EPS” off its January high of nearly 30x (Figure 2). We believe profit growth will continue to be the main driver of stock returns going forward as higher rates should pressure multiples from expanding to levels we saw early in the pandemic recovery.
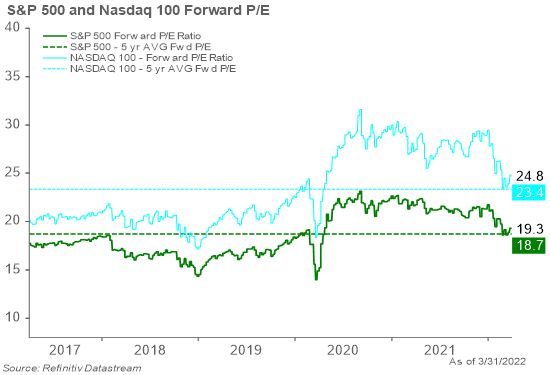 Figure 2
As large cap valuations look more reasonable, we view them as more attractive than in previous quarters shifting some small and mid-cap exposure back into large cap. Large cap stocks should weather the rate and inflation storm better than smaller companies as their economies of scale allow them to better handle pricing pressures. In a stagflation environment, companies with pricing power and a higher fixed cost base relative to variable costs should do well. Real estate and infrastructure investments have characteristics which can allow them to perform well during periods of above average inflation and look attractive to us in this environment while providing portfolio diversification.
International Headwinds
Despite attractive valuations, we grow more cautious on international stocks and now favor a neutral allocation between domestic and international stocks. War in Ukraine and the crippling economic sanctions on Russia as a punishment for the invasion by other global superpowers have pressured energy prices. Many European countries rely heavily on Russia for natural gas imports and as a result are experiencing significant cost pressures. We could see additional supply chain issues if Russia stops natural gas exports as retaliation for the sanctions.
Additionally, higher rates in the US relative to the rest of the world could lead to US Dollar strength, which could hurt non-US stocks, particularly emerging market stocks. Risks in China such as the Chinese governance issues clamping down on tech companies, credit concerns in the Chinese real estate market, a resurgence of COVID lockdowns, and aggressive rhetoric related to Taiwan keep us from adding additional exposure in emerging markets as well.
Bond Yields Move Higher
Interest rates rose during the quarter as investors continued to digest rising inflation data. The U.S. Treasury yield curve moved higher and flattened (Figure 3). The front and intermediate portions of the yield curve ended the quarter trading above the yield on the 10-year Treasury. A yield curve inversion is rare and can be a signal of an economic downturn.
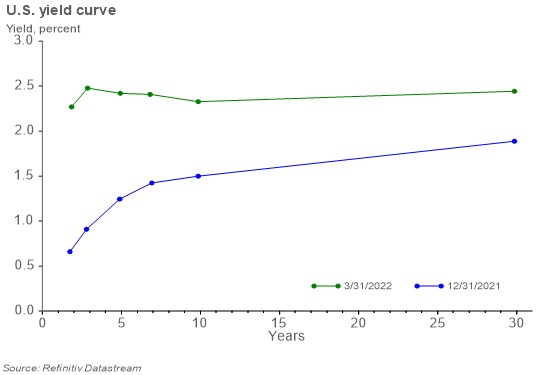 Figure 3
The market believes the Fed must act aggressively to squash inflation in the near term but is concerned about how less accommodative monetary policy will impact growth in the long term. The Fed increased the Fed Funds Rate 0.25% during March and is expected to institute a series of rate increases over the course of the year. The Fed is in a difficult position having to raise rates to achieve their mandate of price stability while simultaneously trying to avoid policy actions that disrupt financial conditions. We believe they will err on the side of acting too cautiously. If they are required to act more aggressively to control inflation, it could create greater downside risk to the economy.
Even though the yield curve is flat, we don’t believe it makes sense to favor very short-term bonds. Interest rates are notoriously difficult to predict. If global risks lead to additional economic pressures, longer duration bonds may prove valuable as a flight to safety if fears of a recession develop.
Rising interest rates have led to negative returns for most types of fixed income investments this year. However, rising rates provide the opportunity to reinvest interest and principal payments at higher yields over time which can lead to higher total returns down the road.
Geopolitical and economic uncertainty have caused credit spreads, or the difference in yield between a corporate bond and a similar maturity Treasury, to rise from year end. An index of BBB rated corporate bonds ended the quarter at 2.1% above the benchmark Treasury interest rate (Figure 4). This increase in credit spreads coupled with the rise in Treasury rates has created more attractive opportunities in investment grade corporate bonds. Corporate balance sheets remain in good shape due to robust economic growth during 2021 and the refinancing wave which occurred over the last few years.
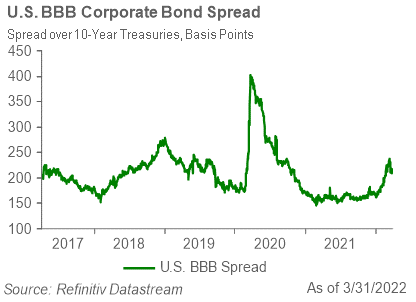 Figure 4
Instead of making a large bet on the direction of interest rates, we believe it makes more sense to take credit risk today. We continue to believe floating rate bank loans, which offer relatively high interest payments at a spread above a common short-term interest rate which resets periodically, look attractive for fixed income investors. This floating rate feature also has benefited this asset class during inflationary environments.
The bottom line
There have been many international emergencies over the years and each one has felt like a “this time it’s different” event. Each time, the S&P 500 has eventually recovered and reached a new high. The fear prevalent today may make it seem desirable to make ill-advised changes to your portfolio. We believe adjusting based on changes to your personal situation is best, even when it can be challenging to ignore the news of the day. The saying “one who fails to plan, is planning to fail” rings true to us. Having a financial plan, and trusted representative you can rely on, makes these periods of fear easier to navigate.
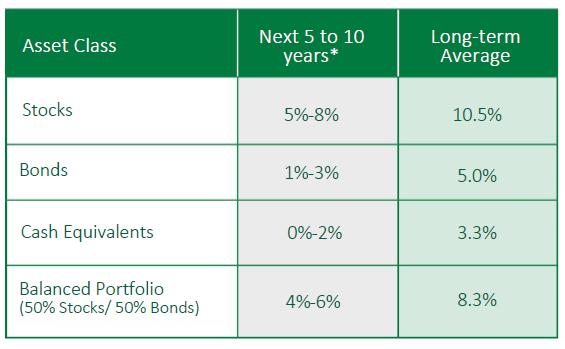 Figure 5
* Forecasted average annual returns of COUNTRY Trust Bank Wealth Management
Source: Morningstar and COUNTRY Trust Bank – See definitions and important information below
COUNTRY Trust Bank Wealth Management Team
- Troy Frerichs, CFA - VP, Investment Services
- Jeff Hank, CFA, CFP® - Manager, Wealth Management
- G. Ryan Hypke, CFA, CFP® - Portfolio Manager
- Weston Chenoweth - Investment Analyst
- Beau Lartz - Investment Analyst
- Chelsie Moore, CFA, CFP® - Director, Wealth Management & Financial Planning
- Kent Anderson, CFA - Portfolio Manager
- Jonathan Strok, CFA - Portfolio Manager
- Jamie Czesak - Investment Analyst
Looking for help navigating your future?
Set up a meeting with your local rep to review your current policies and make sure they're up to date. We pulled together some less obvious reasons to adjust your coverage.
COUNTRY Financial® is a family of affiliated companies (collectively, COUNTRY) located in Bloomington, IL. Learn more about who we are.
NOT FDIC-INSURED
May lose value
No bank guarantee
All information is as of the report date unless otherwise noted.
This material is provided for informational purposes only and should not be used or construed as investment advice or a recommendation of any security, sector, or investment strategy. All views expressed and forward-looking information, including forecasts and estimates, are based on the information available at the time of writing, do not provide a complete analysis of every material fact, and may change based on market or other conditions. Statements of fact are from sources considered reliable, but no representation or warranty is made as to their completeness or accuracy. Unless otherwise noted, the analysis and opinions provided are those of the COUNTRY Trust Bank investment team identified above and not necessarily those of COUNTRY Trust Bank or its affiliates.
Diversification, asset allocation and rebalancing do not assure a profit or guarantee against loss. All market indexes are unmanaged, and returns do not include fees and expenses associated with investing in securities. It is not possible to invest directly in an index.
Investment management, retirement, trust and planning services provided by COUNTRY Trust Bank®.
Past performance does not guarantee future results. All investing involves risk, including risk of loss.
Definitions and Important Information
Figures 1,2,3,4: Chart data comes from Refinitiv (formerly Thomson Reuters) DataStream, a powerful platform that integrates top-down macroeconomic research and bottom-up fundamental analysis.
Figure 5: The long-term average return data comes from Morningstar and is based upon compound average annual returns for the period from 1926 through December 31, 2021 Stocks are represented by the Ibbotson® Large Company Stock Index, which is comprised of the S&P 500® Composite Index from 1957 to present, and the S&P 90® Index from 1926 to 1956. Bonds are represented by the Ibbotson® U.S. Intermediate-Term Government Bond Index. Cash Equivalents are represented by the 30-day U.S. Treasury bill. The “Balanced Portfolio” is representative of an investment of 50% stocks and 50% bonds rebalanced annually. Forecasted stock returns include small capitalization and international equities. Forecasted bond returns include investment grade corporate bonds. These returns are for illustrative purposes and not indicative of actual portfolio performance. It is not possible to invest directly in an index.
The S&P 500® Index is an unmanaged index consisting of 500 large-cap U.S. stocks. Since it includes a significant portion of the total value of the market, it also considered representative of the market. The index does not reflect investment management fees, brokerage commission and other expenses associated with investing in equity securities. It is not possible to invest directly in an index.
GDP or Gross Domestic Product is the monetary value of all goods and services produced during a specified period. The figure is used as a barometer of an economy’s health including its size and growth rate. In the U.S., quarterly GDP figures are typically “annualized” meaning the quarterly growth is compounded for four quarters.
The federal funds rate is the interest rate at which depository institutions lend reserve balances to other depository institutions overnight. The Federal Open Market Committee, which is the primary monetary policymaking body of the Federal Reserve, sets its desired target range.
The real rate of return is the return on an investment after adjusting for inflation. It is calculated by taking the gross return after subtracting the inflation rate.
A basis point is equal to one hundredth of one percent. It is used chiefly in expressing differences in interest rates.
The yield curve plots the interest rates of similar-quality bonds against their maturities. The most common yield curve plots the yields of U.S. Treasury securities for various maturities. An inverted yield curve occurs when short-term rates are higher than long-term rates.
The Morgan Stanley Capital International All Country World Index Ex-U.S. (MSCI ACWI Ex-U.S.) is a market-capitalization-weighted index maintained by Morgan Stanley Capital International (MSCI). It is designed to provide a broad measure of stock performance throughout the world, except for U.S.-based companies. The MSCI ACWI Ex-U.S. includes both developed and emerging markets.
The price-to-earnings ratio is a valuation ratio which compares a company's current share price with its earnings per share (EPS). EPS is usually from the last four quarters (trailing P/E), but sometimes it can be derived from the estimates of earnings expected in the next four quarters (projected or forward P/E). The ratio is also sometimes known as "price multiple" or "earnings multiple."
Stocks of small-capitalization companies involve substantial risk. These stocks historically have experienced greater price volatility than stocks of larger companies, and they may be expected to do so in the future.
The Consumer Price Index (CPI) measures the average change in prices over time that consumers pay for a basket of goods and services. Core CPI is the CPI subtracting energy and food prices.
International investing involves risks not typically associated with domestic investing, including risks of adverse currency fluctuations, potential political and economic instability, different accounting standards, limited liquidity and volatile prices.
The BBB rating is a credit rating used by S&P and Fitch credit rating agencies for long term bonds and some other investments. It is equivalent to the Baa2 rating used by Moody’s. A BBB rating represents a relatively low risk bond or investment. However, it is toward the bottom of investment grade bond ratings, being only two grades above junk bond ratings.
Fixed income securities are subject to various risks, including changes in interest rates, credit quality, market valuations, liquidity, prepayments, early redemption, corporate events, tax ramifications and other factors. Debt securities typically decrease in value when interest rates rise. The risk is usually greater for longer-term debt securities. Investments in lower-rated and nonrated securities present a greater risk of loss to principal and interest than higher- rated securities.
The labor force participation rate is the percentage of the population that is working or actively looking for work.
The Cboe Volatility Index® (VIX Index) is a measure of market expectations of near-term volatility conveyed by S&P 500® index option prices. The VIX Index is widely considered to be the world's premier barometer of investor sentiment and market volatility.