Market and Economic Outlook - Released 3/31/21
Key takeaways
- We continue to believe an economic recovery is likely in 2021. Given the continued reopening of the economy and the $1.9 trillion fiscal stimulus passed in March, we believe it is unlikely that the economy falls into a double-dip recession.
- The main street economy is poised for reopening and renewal, and the valuation of the S&P 500® reflects this optimism.
- We feel bond interest rates may continue to drift higher through the summer as we expect economic growth will accelerate, but do not anticipate rates will move substantially higher long term.
Flash back one year ago, during the onset of the COVID-19 pandemic we wrote, “While it may be too early to know when we fully recover from this crisis, we are optimistic that Americans will navigate this crisis as they have many times before with great resiliency.” Now, one year later, we find ourselves in the midst of recovery. With evidence of effective vaccines and a decline in COVID-19 cases and hospitalization rates, we remain optimistic for spring, summer and beyond. Global stock markets continued their resilience during the first quarter with the S&P 500 rising 6.17% after rising 18% in 2020. In the shadows of this optimism are enduring headlines of risks, with many investors asking how long can the good times last?
Signs of Economic Recovery
We continue to believe an economic recovery is likely in 2021. Given the continued reopening of the economy and the $1.9 trillion fiscal stimulus passed in March, we believe it is unlikely that the economy falls into a double-dip recession. Mix in an accommodative Federal Reserve, intent on keeping interest rates low, and it appears to be an attractive backdrop to keep the music playing. For these reasons, we remain overweight stocks vs. bonds in multi-asset portfolios.
Government stimulus packages have made the consumer flush with cash which seems to be finding its way to financial markets. As of the end of 2020, the amount Americans held in checking accounts, savings accounts, time deposits, and money market funds was up $3.6 trillion from the year prior. The household debt service ratio has gone down, and the personal savings rate continues to trend above levels seen in recent history prior to 2020 [Figure 1]. Surprisingly, many consumers may be emerging from this crisis in solid financial shape.
While there remains approximately 8.5 millioni fewer Americans with jobs than in February of 2020, we continue to see improvements in unemployment data since the onset of the pandemic. This backdrop makes us believe that there is sizable pent up demand for consumption of goods, services, and entertainment which we think will lead to continued downward pressure on unemployment rates and improving economic growth. The 2020 economic downturn was not caused by an overleveraged consumer, rising interest rates, or a spike in oil prices. As a result, a faster recovery is more likely than during other downturns we have seen in the past, and we are already seeing data that supports this scenario.
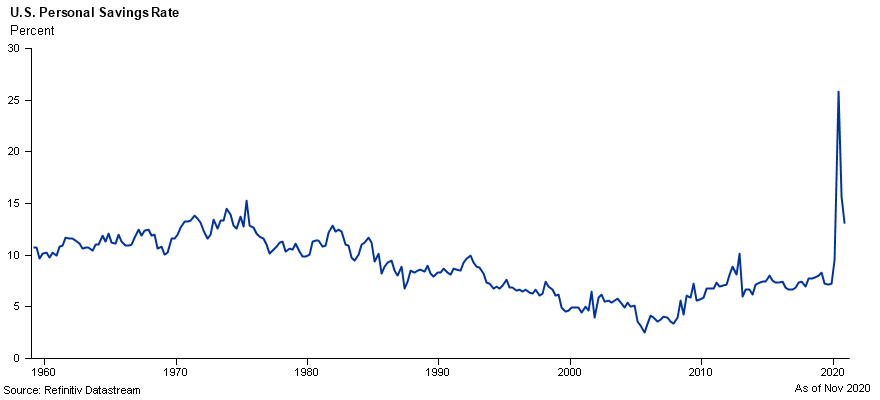 Figure 1
Inflation Expectations Rise
Increased vaccinations around the world should continue to support the economic recovery and allow for a return to normalcy. We also expect inflation readings to tick up as a side-effect to the unprecedented fiscal stimulus injected into the economy in effort to thwart the recession brought on by the pandemic. We have not seen a significant rise in inflation yet, as measured by the consumer price index, but we have started to see inflationary pressures in energy, commodities, and building materials.
To coincide with these pressures, we have seen a rise in market expectations as measured by the 10-year breakeven inflation rateii which measures investors inflation expectations over the next 10 years. This leads us to believe that some of this increased inflation has already been priced into the market. If consumers begin spending the cash sitting on their personal balance sheets, we may see additional inflationary pressures. We continue to monitor the velocity of money, or the rate at which consumers and businesses in an economy, spend money. This is a key metric to determine if the increased money supply as a result of the stimulus measures is starting to flow into the economy [Figure 2].
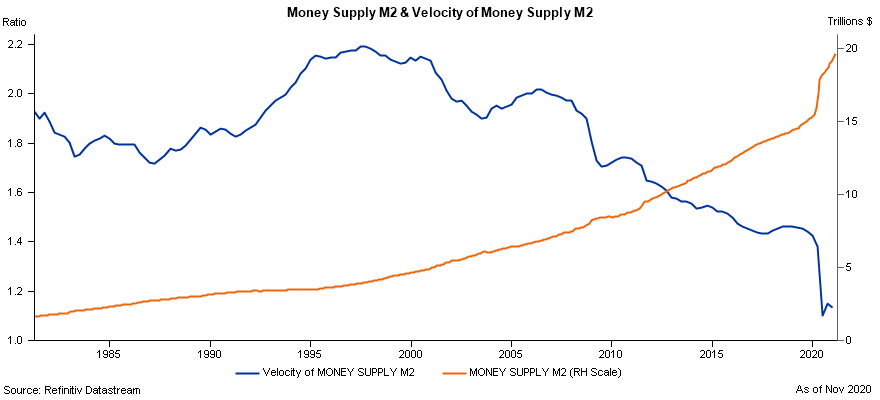 Figure 2
We will also continue to watch the impact excess savings, in the form of cash currently being held in checking and savings accounts, could have on the financial system if this money is used to make speculative investments. The proliferation of “free” online stock trading the last few years, cryptocurrency volatility, and the popularity of start-up investments commonly known as SPACs may be signs of excess.
Optimism Reflected in Current Valuations
The main street economy is poised for reopening and renewal, and the valuation of the S&P 500 reflects this optimism. Comparing the level of the forward P/E of the S&P compared to history shows valuations are elevated. Though U.S. large cap stocks look expensive relative to history, the S&P’s earnings yield vs. Treasuries paints a different picture [Figure 3]. By this metric, the S&P 500 still looks relatively attractive, even after accounting for the recent rise in interest rates. In fact, analyst S&P 500 earnings estimates are rising when normally they are set optimistically and ratcheted down. While the forward P/E ratio looks high for the S&P 500, valuations look more reasonable if you factor in the earnings recovery from the reopening of the global economy.
Since November of 2020, we have seen a rotation out of growth stocks into value and small cap names which are more cyclical in nature and may benefit from the reopening. Increased economic activity benefits more cyclical areas of the market. Generally, a rapid increase in interest rates impacts growth stocks negatively because earnings for many of these companies are well into the future. At higher levels of rates, investors expect a higher return, which reduces the value of these stocks today. We feel cyclical stocks continue to look attractive as the reopening accelerates this summer. Non-U.S. stocks tend to have a heavier weighting to financial, industrial and materials sectors. Given the cyclical nature of non-U.S. stocks, we believe they look attractive relative to U.S. large caps.
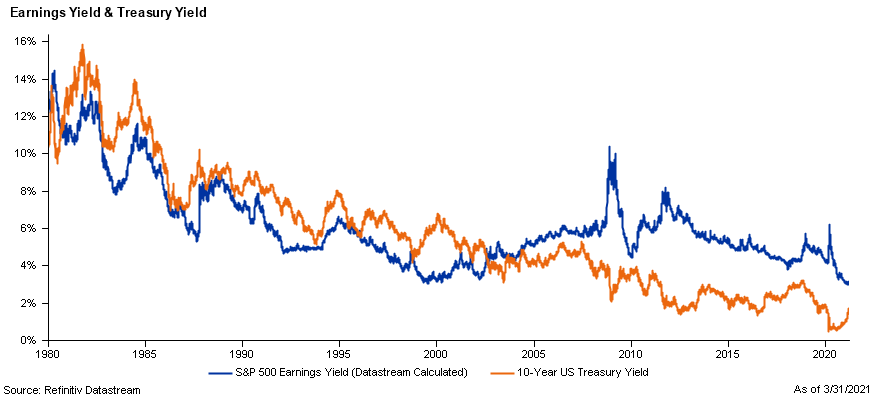 Figure 3
Rates Rise Sharply
U.S. Treasury bond rates rose significantly during the quarter with the sharpest increase during February. The yield curve steepened with longer rates rising faster than short term rates [Figure 4]. Many investors wondered if the Federal Reserve would take action to slow the increase. However, Fed Chairman Jerome Powell stated they remain committed to low rates until the U.S. economy exceeds their long-term employment and inflation targets. The rising rate environment resulted in investment grade bonds producing negative returns over the quarter as the Barclays Universal Bond Index returned -3.05% However, the S&P 500 has declined more than 3.0% on 17 different days over the last 2 years. You could say a bad quarter in bonds is not as painful as a bad day in stocks.
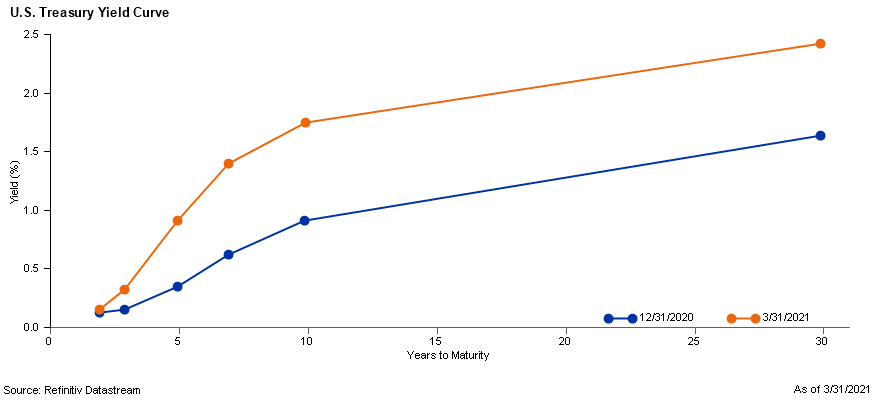 Figure 4
When interest rates rise, new bonds typically offer yields that mirror that change. When that happens, existing bonds become less attractive in the marketplace and their prices decline. A rising rate environment is not the worst thing for long term bond holders. Rising rates provide the opportunity to reinvest interest and principal payments at higher yields over time. Despite the move higher in U.S. Treasuries, credit spreads, or the difference in yield between a corporate bond and a similar maturity Treasury, have not moved meaningfully higher from where they ended 2020. The overall level of interest rates on corporate bonds is higher, but the lack of additional yield for taking on credit risk, makes it a challenging environment for bond investors seeking higher returns.
We feel bond interest rates may continue to drift higher through the summer as we expect economic growth will accelerate, but do not anticipate rates will move substantially higher long term. Demand for fixed income remains high. Inflows into investment grade bond funds and ETFs remained strong during the quarter. Institutional investors, such as banks and insurance companies, have excess cash they are required to invest. Many investors are looking for alternatives to cash which is paying near 0% today. Foreign investors can earn a higher yield investing in the U.S. even after hedging their currency risk. All these factors are likely to keep a lid on U.S. rates.
We have been positioning bond portfolios to have a shorter duration than our benchmark. We continue to believe preferred stocks, floating-rate loans, and emerging market debt offer attractive yields relative to investment grade bonds. These income producing assets have less interest rate risk but can be more volatile in an economic downturn. These allocation decisions have benefited relative returns compared to our benchmark during this current move higher in rates. Despite the challenging quarter, we continue to believe investment grade bonds are a valuable component of multi asset portfolios.
The bottom line
Spring has always been a season of hope and new beginnings. It appears to us the global economy, backed by low interest rates and vast amounts of stimulus, is on track to bloom during 2021. However, it is important to note investment returns can deviate from the economy in the short term. Partnering with a trusted source to develop a long-term plan can provide peace of mind as the world emerges from the COVID-19 pandemic and beyond.
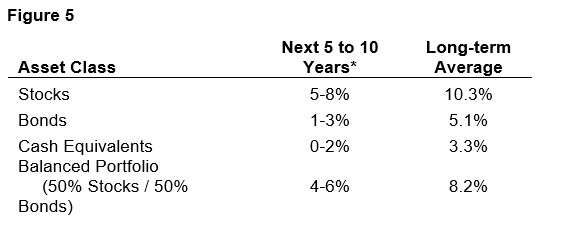 Figure 5
* Forecasted average annual returns of COUNTRY Trust Bank Wealth Management
Source: Morningstar and COUNTRY Trust Bank – See important information below
COUNTRY Trust Bank wealth management team
- Troy Frerichs, CFA - VP, Investment Services
- Jeff Hank, CFA, CFP® - Manager, Wealth Management
- G. Ryan Hypke, CFA, CFP® - Portfolio Manager
- Weston Chenoweth - Investment Analyst
- Molly Ruddy - Investment Analyst
- Chelsie Moore, CFA, CFP® - Director, Wealth Management & Financial Planning
- Kent Anderson, CFA - Portfolio Manager
- Jonathan Strok, CFA - Portfolio Manager
- Jamie Czesak - Investment Analyst
Looking for help navigating your future?
Set up a meeting with your local rep to review your current policies and make sure they're up to date. We pulled together some less obvious reasons to adjust your coverage.
COUNTRY Financial® is a family of affiliated companies (collectively, COUNTRY) located in Bloomington, IL. Learn more about who we are.
NOT FDIC-INSURED
May lose value
No bank guarantee
All information is as of the report date unless otherwise noted.
This material is provided for informational purposes only and should not be used or construed as investment advice or a recommendation of any security, sector, or investment strategy. All views expressed and forward-looking information, including forecasts and estimates, are based on the information available at the time of writing, do not provide a complete analysis of every material fact, and may change based on market or other conditions. Statements of fact are from sources considered reliable, but no representation or warranty is made as to their completeness or accuracy. Unless otherwise noted, the analysis and opinions provided are those of the COUNTRY Trust Bank investment team identified above and not necessarily those of COUNTRY Trust Bank or its affiliates.
Diversification, asset allocation and rebalancing do not assure a profit or guarantee against loss. All market indexes are unmanaged, and returns do not include fees and expenses associated with investing in securities. It is not possible to invest directly in an index.
Investment management, retirement, trust and planning services provided by COUNTRY Trust Bank®.
Past performance does not guarantee future results. All investing involves risk, including risk of loss.
Definitions and Important Information
Figures 1,2,3,4: Chart data comes from Refinitiv (formerly Thomson Reuters) Datastream, a powerful platform that integrates top-down macroeconomic research and bottom-up fundamental analysis.
The S&P 500® Index is an unmanaged index consisting of 500 large-cap U.S. stocks. Since it includes a significant portion of the total value of the market, it also considered representative of the market. The index does not reflect investment management fees, brokerage commission and other expenses associated with investing in equity securities. It is not possible to invest directly in an index.
GDP or Gross Domestic Product is the monetary value of all goods and services produced during a specified time period. The figure is used as a barometer of an economy’s health including its size and growth rate. In the U.S., quarterly GDP figures are typically “annualized” meaning the quarterly growth is compounded for four quarters.
The federal funds rate is the interest rate at which depository institutions lend reserve balances to other depository institutions overnight. The Federal Open Market Committee, which is the primary monetary policymaking body of the Federal Reserve, sets its desired target range.
A basis point is equal to one hundredth of one percent. It is used chiefly in expressing differences in interest rates.
The yield curve plots the interest rates of similar-quality bonds against their maturities. The most common yield curve plots the yields of U.S. Treasury securities for various maturities. An inverted yield curve occurs when short-term rates are higher than long-term rates.
The BBB rating is a credit rating used by S&P and Fitch credit rating agencies for long term bonds and some other investments. It is equivalent to the Baa2 rating used by Moody’s. A BBB rating represents a relatively low risk bond or investment. However, it is toward the bottom of investment grade bond ratings, being only two grades above junk bond ratings.
The price-to-earnings ratio is a valuation ratio which compares a company's current share price with its earnings per share (EPS). EPS is usually from the last four quarters (trailing P/E), but sometimes it can be derived from the estimates of earnings expected in the next four quarters (projected or forward P/E). The ratio is also sometimes known as "price multiple" or "earnings multiple."
The Consumer Price Index (CPI) is a measure of the average change over time in the prices paid by urban consumers for a market basket of consumer goods and services.
The velocity of money is the frequency at which one unit of currency is used to purchase domestically produced goods and services within a given time period.iii
M2 Money Supply consists of M1 plus: small-denomination time deposits (time deposits in amounts of less than $100,000) less IRA and Keogh balances at depository institutions; and balances in retail MMFs less IRA and Keogh balances at MMFs.iv
The breakeven inflation rate represents a measure of expected inflation derived from 10-Year Treasury Constant Maturity Securities and 10-Year Treasury Inflation-Indexed Constant Maturity Securities. The latest value implies what market participants expect inflation to be in the next 10 years, on average.i
Stocks of small-capitalization companies involve substantial risk. These stocks historically have experienced greater price volatility than stocks of larger companies, and they may be expected to do so in the future.
Stocks of mid-capitalization companies may be slightly less volatile than those of small-capitalization companies but still involve substantial risk and they may be subject to more abrupt or erratic movements than large capitalization companies.
International investing involves risks not typically associated with domestic investing, including risks of adverse currency fluctuations, potential political and economic instability, different accounting standards, limited liquidity and volatile prices.
Fixed income securities are subject to various risks, including changes in interest rates, credit quality, market valuations, liquidity, prepayments, early redemption, corporate events, tax ramifications and other factors. Debt securities typically decrease in value when interest rates rise. The risk is usually greater for longer-term debt securities. Investments in lower-rated and nonrated securities present a greater risk of loss to principal and interest than higher-rated securities.
Sector investments tend to be more volatile than investments that diversify across companies in many sectors.
i U.S. Bureau of Labor Statistics, Employment Level [CE16OV], retrieved from FRED, Federal Reserve Bank of St. Louis
ii Federal Reserve Bank of St. Louis, 10-Year Breakeven Inflation Rate [T10YIE], retrieved from FRED, Federal Reserve Bank of St. Louis
iii Federal Reserve Bank of St. Louis, Velocity of M2 Money Stock [M2V], retrieved from FRED, Federal Reserve Bank of St. Louis
iv Board of Governors of the Federal Reserve System (US), M2 Money Stock [M2NS], retrieved from FRED, Federal Reserve Bank of St. Louis