Market and Economic Outlook - Released 3/31/20
Key takeaways
- While broad stock market indices have moved off their lows, uncertainty remains regarding the impact COVID-19 containment measures will have on economic growth in the U.S. and around the world.
- Current valuations, the low interest rate environment, and government stimulus efforts support our view of a slight overweight to stocks versus bonds in multi asset portfolios.
- Even though it was an unstable period in fixed income markets, investment grade bonds continued to be an important diversifier for multi asset portfolios.
During his 1933 Presidential inaugural address Franklin D. Roosevelt famously said to the American people “the only thing we have to fear is...fear itself.” America was locked in the Great Depression and President Roosevelt believed the fears of U.S. citizens were making the economic malaise worse. Today, the coronavirus (COVID-19) has spread rapidly creating fear and panic across the globe. This fear has gripped the financial markets and economic activity is grinding to a halt as much of the world fights the virus. The uncertainty surrounding how long this fight will last, and what the response will be, has prompted panicked investors to sell all types of securities in favor of cash.
Economic impact
This dramatic sell off resulted in the end of the longest running bull market in history with the S&P 500 falling nearly 34% from its intra-year closing high. While the S&P 500 has moved off its lows, uncertainty remains regarding the impact containment measures will have on economic growth in the U.S. and around the world. In our view, heightened volatility will remain for at least the near term as a result of this uncertainty. We continue to monitor the spread of COVID-19 cases in the U.S. for signs of a “flattening curve” that may shed light on peak case growth and expected resumption of normal economic activity. (Figure 1) This is not to downplay the impact the virus has had—and may continue to take—on humanity, but it may provide insight on when we will return to a sense of normalcy.
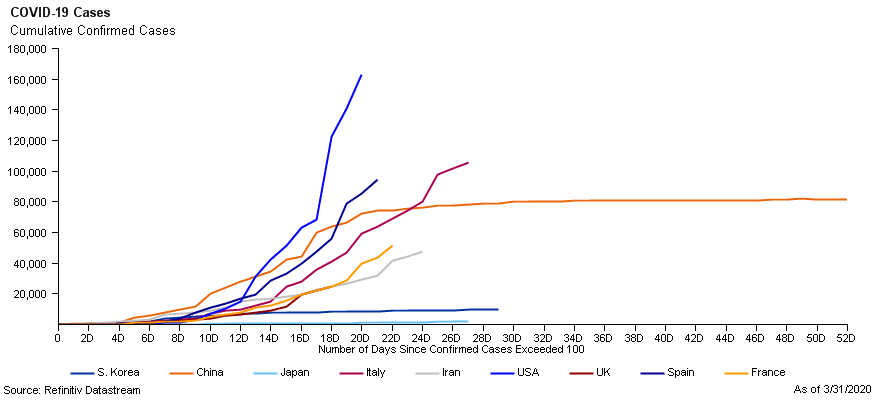 Figure 1
We will continue to look for more clarity on the ramifications of broad “shelter-in-place” orders and forced business closures across the U.S. We do know that weekly unemployment claims surged to their highest level on record, far surpassing peak figures seen during the depths of the 2008/2009 global financial crisis, as many workers have been laid off or furloughed due to government mandated and voluntary business closures. (Figure 2) How quickly the labor force can get back to work will dictate the slope and robustness of any potential recovery.
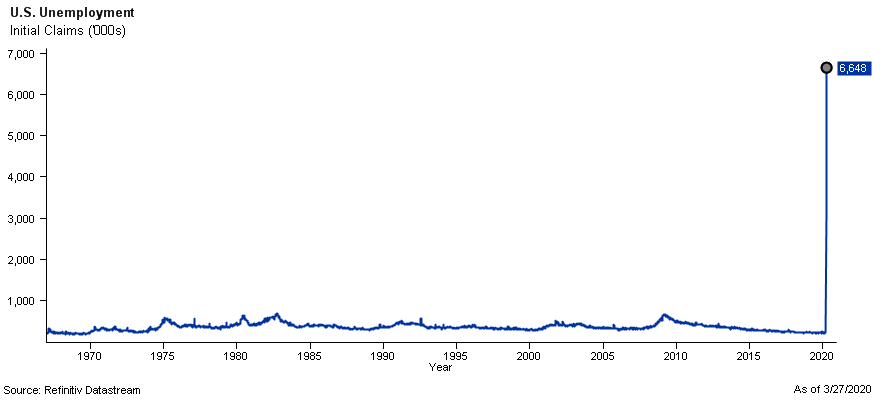 Figure 2
Looking for signs of improvement
The policy response from global central banks has been massive as well as the $2 trillion fiscal stimulus measures passed on March 27th by the United States Congress. Private companies are aggressively working on vaccines, therapies, and donating supplies to aid in fighting the virus. There have been many pandemics, wars, and natural disasters over the years, and the S&P 500 has a history of bouncing back from these crises. While we may see a decline in gross domestic product (GDP) growth for two or more quarters, resulting in a technical recession, the fundamentals of the U.S. economy were showing signs of strength prior to the coronavirus outbreak. Interest rates remain low and we anticipate significant pent up demand is building as many Americans are currently quarantined in their homes, creating the potential for an eventual recovery beyond the short-term uncertainty. While it may be too early to know when we fully recover from this crisis, we are optimistic that Americans will navigate this crisis as they have many times before with great resiliency.
Compelling valuations
We discussed in our Market and Economic Outlook from 12/31 that we were skeptical of further increases in the price-to-earnings ratio (P/E) in 2020 stating that we thought earnings growth would be necessary to support a continued run up in stocks. Now we believe consensus corporate earnings growth estimates will fall as the containment measures shut down a large portion of business activity across the U.S. However, the decline in broad stock market indices has made valuations on many stocks look more attractive. (Figure 3) Current valuations, the low interest rate environment, and government stimulus efforts support our view of a slight overweight to stocks versus bonds in multi asset portfolios.
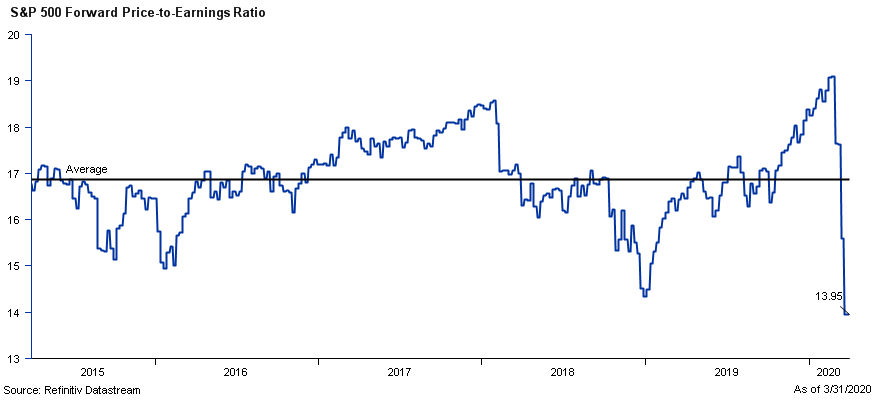 Figure 3
During the recent sell off, small cap companies have underperformed significantly. While we acknowledge the challenging environment for small business, we are finding valuations that look very attractive in this segment of the marketplace. We continue to be cautious about international markets, but in certain regions valuations appear cheap, particularly in emerging markets, as some stocks seem to still be pricing in the worst-case scenario.
Bonds face pressure
As we discussed in our special report on the Coronavirus Impact on Fixed Income Markets, bond markets were not immune to erratic trading during the quarter. During the middle of March, many investors began indiscriminately selling all types of bonds in favor of cash. This included the highest quality and most liquid bonds such as treasury securities, which are typically viewed as a haven in times of duress. The interest rates many corporate bonds pay over treasuries also widened substantially during the quarter, negatively impacting returns on these types of bonds (Figure 4). The selling pressure was so pronounced in March that bond dealers were unable to take additional inventory on their balance sheets, as post-2008/2009 financial crisis regulations limited their ability to assume this risk. As a result, the bond market was not trading efficiently. These inefficiencies caused dislocations in the marketplace, making things difficult for bond sellers, but creating opportunities for buyers.
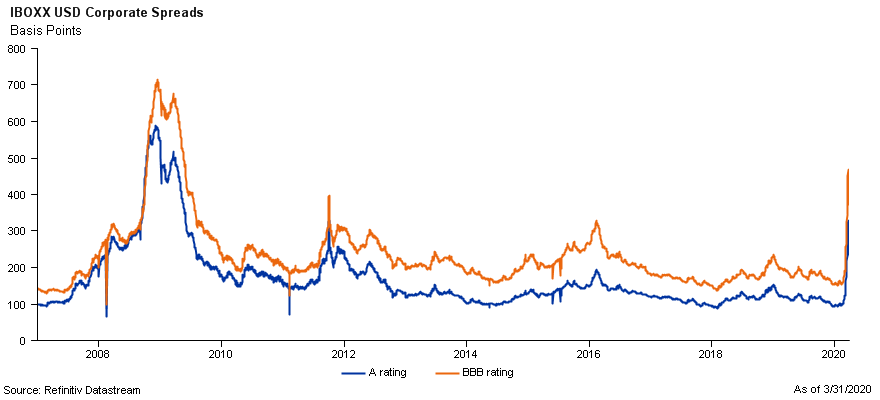 Figure 4
In response to this, the Federal Reserve executed a variety of unprecedented actions during the quarter to boost liquidity and ease lending conditions. They implemented a variety of initiatives to improve liquidity and functioning of short-term financing markets. They cut the target range for the federal funds rate 1.50% during two emergency meetings to 0-0.25%. They also restarted their asset purchase program, directly buying treasury, corporate, and mortgage backed bonds. This was a technique used extensively during the 2008/2009 financial crisis but at that time only included treasury and mortgage backed securities. They reestablished an asset backed securities lending facility to support the student loan, credit card, and auto lending markets. They also implemented programs to support lending to small businesses. The Fed’s actions seem to have stabilized bond trading, and they have stated they will use every tool at their disposal to facilitate the smooth functioning of financial markets. The dislocations in the bond market created some attractive opportunities in certain segments. Over the past few weeks, we began seeing opportunities in preferred stocks, emerging market bonds, and floating rate loans.
Even though it was an unstable period in fixed income markets, investment grade bonds continued to be an important diversifier for multi asset portfolios. The Bloomberg Barclays U.S. Aggregate Bond index managed a positive return of +3.15% for the quarter, an example of how high-quality bonds can provide a haven during these unsettling times.
The bottom line
Throughout history, there have been numerous events that have tested the patience of investors. However, the 1st quarter of 2020 may go down as one of the most challenging and volatile periods ever. Like Roosevelt, we acknowledge the severity of the crisis at hand, but believe the resolve of the American people will prevail.
The most important issues facing the world today include stopping the spread of the virus, maintaining the health of all, and hopefully getting back to some sense of normalcy in daily life. However, as disciplined investors, we continue to focus on the investment opportunities in front of us and tune out the headlines and doomsayers. These are the times when we see the value of having a plan in place to help investors navigate short term uncertainty and stay on track with their investment goals.
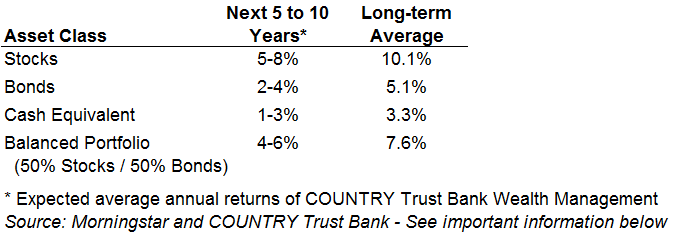 Figure 5
COUNTRY Trust Bank wealth management team
- Troy Frerichs, CFA - VP, Investment Services
- Jeff Hank, CFA, CFP® - Manager, Wealth Management
- Jonathan Strok, CFA - Portfolio Manager
- Jamie Czesak - Investment Analyst
- Chelsie Moore, CFA, CFP® - Director, Wealth Management & Financial Planning
- Kent Anderson, CFA - Portfolio Manager
- Weston Chenoweth - Investment Analyst
- Molly Ruddy - Investment Analyst
Looking for help navigating your future?
Set up a meeting with your local rep to review your current policies and make sure they're up to date. We pulled together some less obvious reasons to adjust your coverage.
COUNTRY Financial® is a family of affiliated companies (collectively, COUNTRY) located in Bloomington, IL. Learn more about who we are.
NOT FDIC-INSURED
May lose value
No bank guarantee
All information is as of the report date unless otherwise noted.
This material is provided for informational purposes only and should not be used or construed as investment advice or a recommendation of any security, sector, or investment strategy. All views expressed and forward-looking information, including forecasts and estimates, are based on the information available at the time of writing, do not provide a complete analysis of every material fact, and may change based on market or other conditions. Statements of fact are from sources considered reliable, but no representation or warranty is made as to their completeness or accuracy. Unless otherwise noted, the analysis and opinions provided are those of the COUNTRY Trust Bank investment team identified above and not necessarily those of COUNTRY Trust Bank or its affiliates.
Diversification, asset allocation and rebalancing do not assure a profit or guarantee against loss. All market indexes are unmanaged, and returns do not include fees and expenses associated with investing in securities. It is not possible to invest directly in an index.
Investment management, retirement, trust and planning services provided by COUNTRY Trust Bank®.
Past performance does not guarantee future results. All investing involves risk, including risk of loss.
Definitions and Important Information
Figures 1,2,3,4: Chart data comes from Refinitiv (formerly Thomson Reuters) Datastream, a powerful platform that integrates top-down macroeconomic research and bottom-up fundamental analysis.
Figure 5: The long-term average return data comes from Morningstar and is based upon compound average annual returns for the period from 1926 through December 31, 2019. Stocks are represented by the Ibbotson® Large Company Stock Index, which is comprised of the S&P 500® Composite Index from 1957 to present, and the S&P 90® Index from 1926 to 1956. Bonds are represented by the Ibbotson® U.S. Intermediate-Term Government Bond Index. Cash Equivalents are represented by the 30-day U.S. Treasury bill. The “Balanced Portfolio” is representative of an investment of 50% stocks and 50% bonds rebalanced annually. Forecasted stock returns include small capitalization and international equities. Forecasted bond returns include investment grade corporate bonds. These returns are for illustrative purposes and not indicative of actual portfolio performance. It is not possible to invest directly in an index.
The S&P 500® Index is an unmanaged index consisting of 500 large-cap U.S. stocks. Since it includes a significant portion of the total value of the market, it also considered representative of the market. The index does not reflect investment management fees, brokerage commission and other expenses associated with investing in equity securities. It is not possible to invest directly in an index.
The Russell 2000® Index measures the performance of the small-cap segment of the U.S. equity universe. The Russell 2000 Index is a subset of the Russell 3000® Index representing approximately 10% of the total market capitalization of that index. It includes approximately 2000 of the smallest securities based on a combination of their market cap and current index membership. The Russell 2000 is constructed to provide a comprehensive and unbiased small-cap barometer and is completely reconstituted annually to ensure larger stocks do not distort the performance and characteristics of the true small-cap opportunity set. The Index does not reflect investment management fees, brokerage commission and other expenses associated with investing in equity securities. It is not possible to invest directly in an index.
The iShares Core U.S. Aggregate Bond ETF seeks to track the investment results of the Bloomberg Barclays US Aggregate Bond Index. The Bloomberg Barclays US Aggregate Bond Index is a broad base, market capitalization-weighted bond market index representing intermediate term investment grade bonds traded in the United States.
The MSCI EAFE Index is broadly recognized as the pre-eminent benchmark for U.S. investors to measure international equity performance. It comprises the MSCI country indexes capturing large and mid-cap equities across developed markets in Europe, Australasia and the Far East, excluding the U.S. and Canada.
The MSCI Emerging Markets Index captures large and mid-cap representation across 26 emerging market countries. The index free float-adjusted market capitalization index and represents 13% of global market capitalization.
The S&P GSCI is a widely recognized benchmark that is broad-based and production weighted to represent the global commodity market beta. The index includes the most liquid commodity futures.
The iBoxx USD Benchmark index spans an array of fixed income sectors including corporate, treasuries, sovereign, sub-sovereign, supranational, and covered, with a history dating back to December 1998.
Brent Crude Oil is a trading classification of sweet light crude oil that serves as a major benchmark price for purchases of oil worldwide. Brent is the leading global price benchmark for Atlantic basin crude oils. It is used to price approximately two thirds of the world’s internationally traded crude oil supplies.
The federal funds rate is the interest rate at which depository institutions lend reserve balances to other depository institutions overnight. The Federal Open Market Committee, which is the primary monetary policymaking body of the Federal Reserve, sets its desired target range.
The yield curve plots the interest rates of similar-quality bonds against their maturities. The most common yield curve plots the yields of U.S. Treasury securities for various maturities. An inverted yield curve occurs when short-term rates are higher than long-term rates.
The price-to-earnings ratio is a valuation ratio which compares a company's current share price with its earnings per share (EPS). EPS is usually from the last four quarters (trailing P/E), but sometimes it can be derived from the estimates of earnings expected in the next four quarters (projected or forward P/E). The ratio is also sometimes known as "price multiple" or "earnings multiple."
Stocks of small-capitalization companies involve substantial risk. These stocks historically have experienced greater price volatility than stocks of larger companies, and they may be expected to do so in the future.
Stocks of mid-capitalization companies may be slightly less volatile than those of small-capitalization companies but still involve substantial risk and they may be subject to more abrupt or erratic movements than large capitalization companies.
International investing involves risks not typically associated with domestic investing, including risks of adverse currency fluctuations, potential political and economic instability, different accounting standards, limited liquidity and volatile prices.
Fixed income securities are subject to various risks, including changes in interest rates, credit quality, market valuations, liquidity, prepayments, early redemption, corporate events, tax ramifications and other factors. Debt securities typically decrease in value when interest rates rise. The risk is usually greater for longer-term debt securities. Investments in lower-rated and nonrated securities present a greater risk of loss to principal and interest than higher-rated securities.
Sector investments tend to be more volatile than investments that diversify across companies in many sectors.