Market and Economic Outlook - Released 9/30/22
Key takeaways
- Markets continue to be negatively affected by the latest inflation readings and investor sentiment is nearing levels seen during the 2008 Financial Crisis.
- The short-term forecast for stocks is uncertain, we feel the longer-term outlook is favorable due to current valuations pricing in some of the current risks.
- Investment grade bond yields are at their highest levels in over 10 years providing an attractive alternative to other asset classes.
Long time investment manager Ralph Wanger once wrote, “the stock market is like a man walking his dog in New York City. The walk is always the same: start at Columbus Circle, stroll through Central Park, and end at the Metropolitan Museum of Art. If you’ve walked a dog, you know they never walk a straight line. They go forward then backward, stop to smell this thing and that thing, jump up randomly on park benches, bark at other furry and feathered creatures. There’s absolutely no predicting where they’re heading next.”
“But if you know the owner is heading roughly northeast toward the museum, you know where the dog is heading too. What is astonishing is that almost all investors, big and small, seem to have their eye on the dog, and not the owner.”
This clever analogy seems to describe the current investment climate. It seems good news is actually bad news. A stronger economy and labor market lead to concerns the Fed will raise interest rates higher and faster than expected. Weaker data suggests the Fed is having success tightening financial conditions. As a result, financial markets continue to be pulled violently in different directions by the latest inflation readings and their impact on the economy. Not surprisingly, investor sentiment is nearing levels seen during the 2008 Financial Crisis (Figure 1).
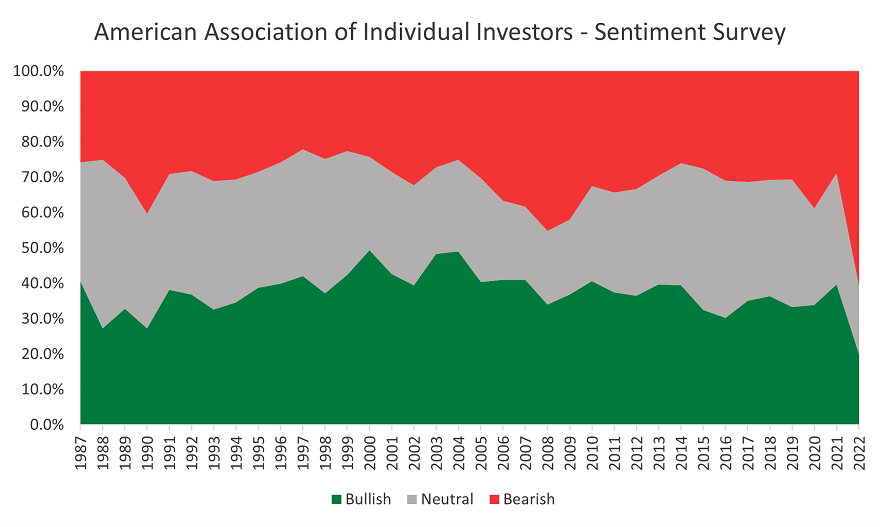 Figure 1
Inflation and the Fed
The Federal Reserve’s goal is to bring inflation back to its 2% target even if they risk weakening the economy in the process. We believe this is a primary factor affecting market sentiment. After a summer of rising CPI (Consumer Price Index) and PCE (Personal Consumption Expenditures) data, the federal funds rate increased 0.75% in late September. Markets expect a 0.75% increase in November and 0.50% in December, bringing the year-end federal funds rate range to 4.25-4.50. The key question for financial markets is how high will the Fed go to control inflation?
Despite the persistence of inflation, the U.S. economy continues to be in decent shape even though overall growth does appear to be slowing. Monetary policy tends to work with a lag. However, the longer inflation remains elevated the more aggressive the Fed will need to be. This opens the risk of making a policy mistake. Aggressive Fed tightening cycles tend to pressure companies with weak balance sheets. Some inflation data is showing signs of topping thanks to lower energy prices with a national gasoline average of $3.73 per gallon down from the record high of $5.02 reached in June earlier this year according to AAA (Figure 2).
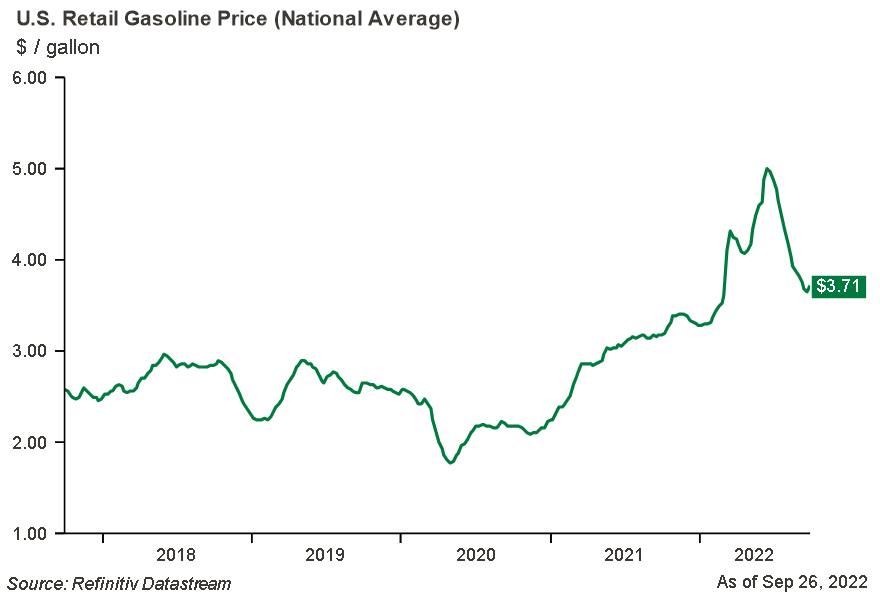 Figure 2
Energy prices are still a wild card making it hard to bring inflation down. There are only so much the Fed and global central banks can do to address energy prices. If gas were to go back to earlier highs, it could result in serious issues for inflation. It is still yet to be seen what will happen once the use of the Strategic Petroleum Reserve ends. The tenuous situation in Ukraine will continue to create concerns about an energy crunch in the Europe this winter. To be clear, inflation is high across the globe and not just contained to the U.S. as can be seen below (Figure 3).
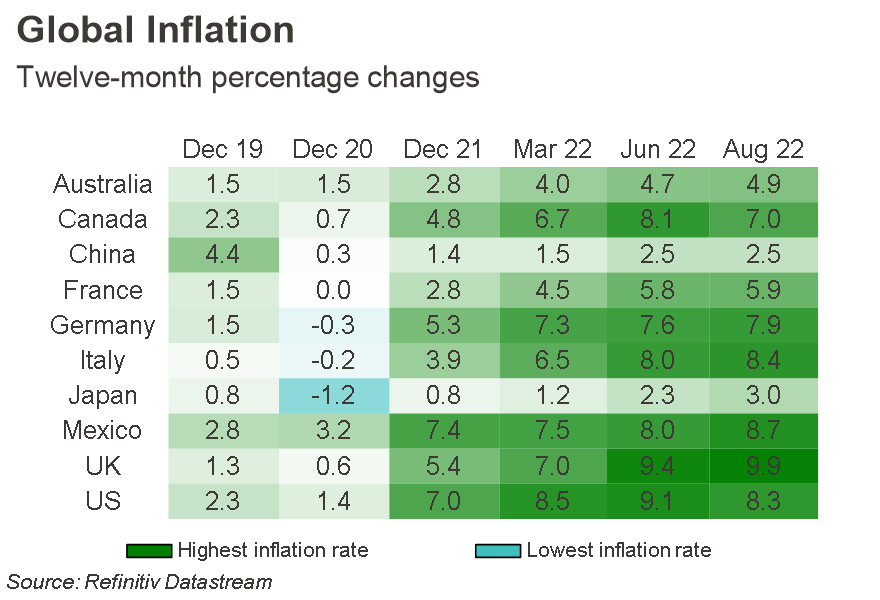 Figure 3
Economic Data Influences Markets
Any recession is likely to be mild given the strength of the labor market. A soft landing for the economy could mean the unemployment rate will go up but not much more than a normalized level. The JOLTS (Job Openings and Labor Turnover Survey) report shows turnover and layoffs modest at best with plenty of job openings. The unemployment rate is still extremely low and jobless claims have been on a downtrend since mid-August. Participation rate increase was a positive which may aid supply constraints and wage pressures.
The downside to a healthy labor market is upward pressure on wages (Figure 4).
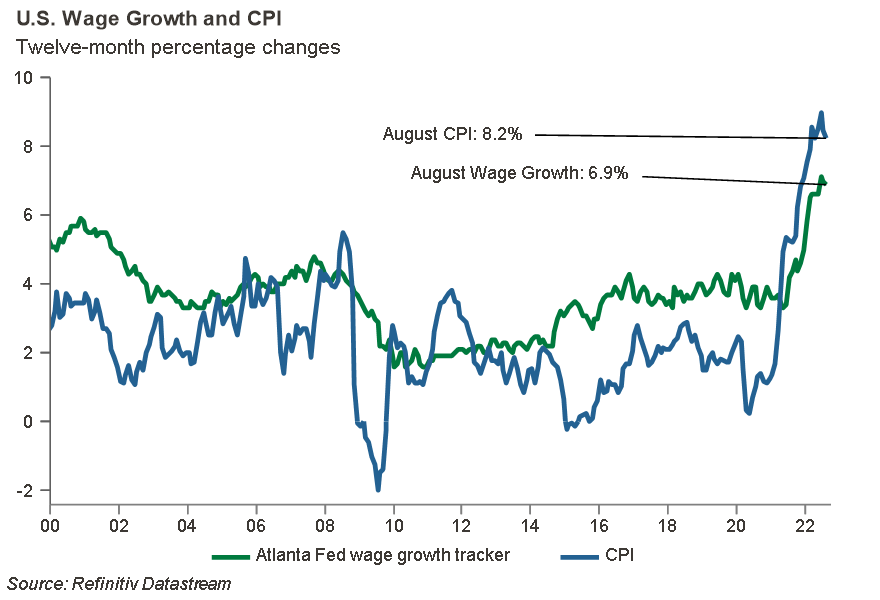 Figure 4
Increases in wages can lead to more prolonged inflation as the cost of goods and services rises as companies pay their employees more. Wages tend to be more ingrained and are less likely to come down.
The housing market has also been strong but is showing signs of slowing where higher mortgage rates are affecting sales with seven consecutive months of declines. Housing prices, which even after a couple of months of declines, are still about 7.7% higher than a year ago according to the National Association of Realtors. This is feeding into core inflation numbers through elevated owners’ equivalent rent, or how much money a property owner would pay in rent to live in their home.
It is still imperative that supply and demand become balanced. Either the supply chains work more efficiently, and we see an increase in the labor participation rate which will moderate wage growth, or consumer demand will need to be reduced.
The positive in all of this is that while GDP growth in the U.S. contracted in the first two quarters of this year down -1.6% and -0.6%, respectively, real growth is expected to be flat to marginally positive this year while rebounding to 1.2% next year and back towards long-term trends in 2024 according to the Fed.
Election Anxiety
November brings the midterm elections in the U.S. which can add to investor apprehension. As we have said in the past, we recommend making portfolio management decisions based on your personal circumstances and not political headlines. A divided House and Senate could keep controversial legislation from being passed. However, we would only be guessing on the outcome and any long-term ramifications for financial markets.
Adjustments based on elections and politics can be a losing proposition. There have been many regimes shifts over the last century and policy announcements can cause short term volatility. However, over time, markets have shown resilience to navigate these policy shifts, and the impact on individual sectors is not always negative, which helps balance out the political risk through diversification.
Volatility Continues yet Valuations Improve
Stocks began the third quarter with a strong rally through mid-August on speculation of a “Fed pivot” away from recent policy in raising the Federal Funds Rate in as aggressive of a manner. Continued strong inflation readings and dire earnings guidance from companies, such as FedEx, put that belief to rest. This led to mid-quarter volatility and the S&P 500 declining for the quarter. We believe earnings and economic data going into year-end will prove to be a “show me” story. This may lead to a range bound market with continued volatility, both on the upside and downside, until the data sends a clearer picture of what the sustained direction of the economy looks like.
To expand on our analysis from last quarter, in a normalized earnings environment, valuations on the S&P 500 are in line with their 25-year averages (Figure 5).
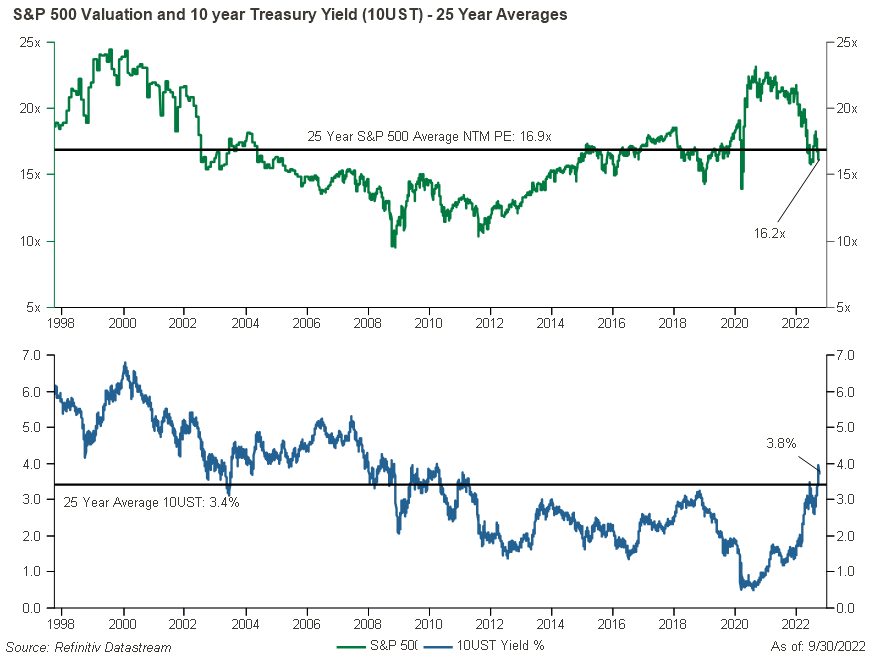 Figure 5
For added context, we compare current valuations with longer term average yields for the 10-year US Treasury bond, which also hovers near 25-year averages. To us, this suggests that stocks appear fairly valued at current earnings levels and may suggest the selloff in 2022 is driven by higher interest rates causing valuation multiples to fall. Stock valuations can be influenced by interest rates for several reasons.
We believe earnings estimates for the S&P 500 companies are likely to be revised lower which could lead to more pressure on stocks, but how much lower is still unknown. While the short-term forecast for stocks is uncertain, we feel over longer time periods the outlook is much more favorable due to current valuations pricing in some of the current risks. We also project an eventual cooling of the high inflationary environment. Because of this we do not believe that short-term factors should be a reason to make dramatic portfolio shifts in effort to time peaks and valleys of the stock market.
Due to the short-term uncertainty, we believe it is prudent to adjust portfolios when necessary while still being appropriately aligned to client’s investment goals. In the current high inflationary environment, we have made a small shift towards quality companies, and as a result have reduced some exposure in small cap companies in favor of large caps. We continue to remain neutral on international stocks as the strong U.S. dollar continues to affect returns for U.S. investors overseas.
Pay Attention to Those Yields
Like stocks, bond market returns have been impacted by elevated inflation readings and concerns of more interest rate increases by global central banks. Rising interest rates continue to produce negative returns for bond investors, making 2022 one of the most challenging fixed income markets in history. Bond values usually move in the opposite direction of interest rates. So, when interest rates rise, existing bonds become less attractive in the marketplace and their prices decline.
Not only has the general level of interest rates risen to compensate for inflation, the credit spread, or the difference in the yield of two bonds with the same maturity, but different credit quality, has risen due to investors apprehension for risk. This difference in interest rates for A rated and BBB rated U.S. corporate bonds, compared to an equivalent Treasury, has risen this year (Figure 6).
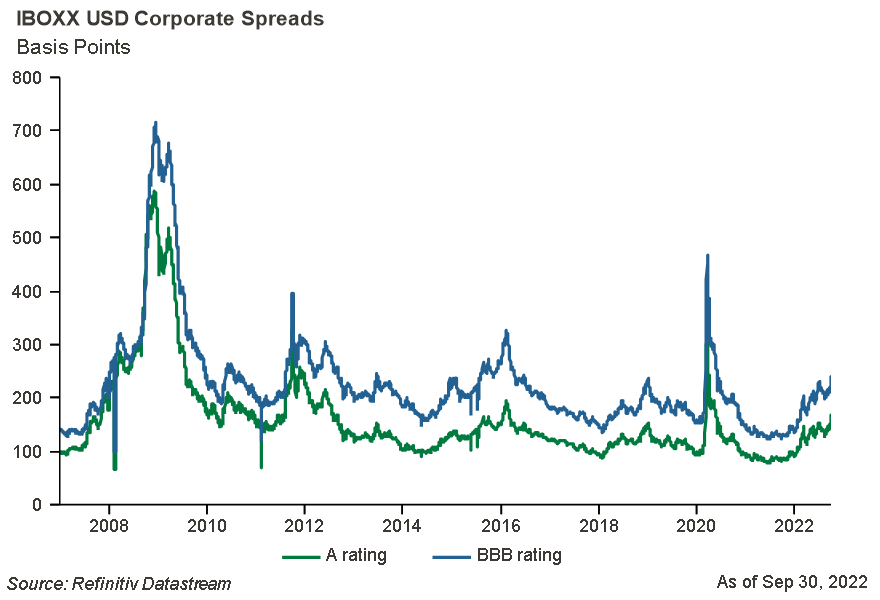 Figure 6
Due to this credit spread widening and move higher in the general level of interest rates, investment grade rated corporate bond yields are at their highest levels in over 10 years (Figure 7). Higher yields now provide an attractive alternative to other asset classes.
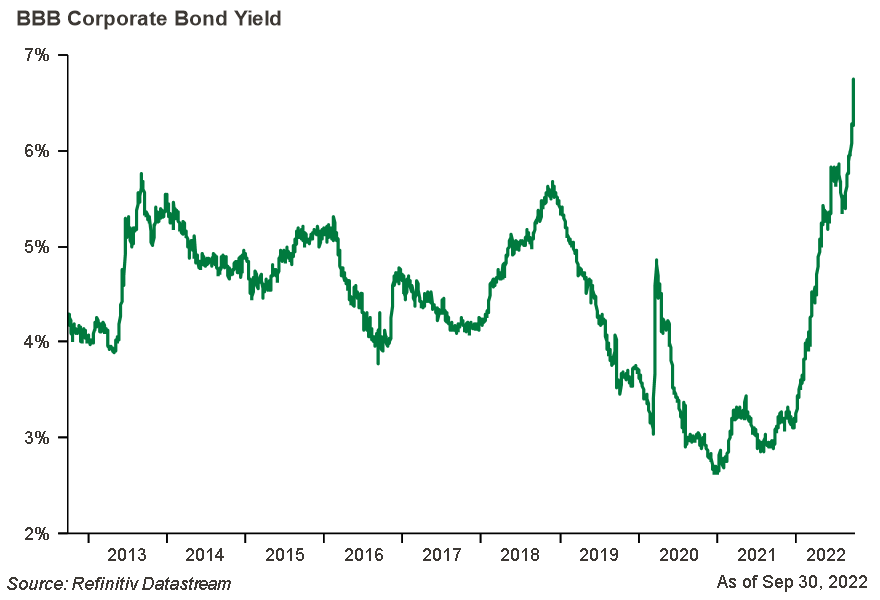 Figure 7
Today’s bond yields also position bonds to have greater downside protection against additional increases in interest rates. For example, a 1% rise in the general level of interest rates over a 1-year period could cause the Bloomberg Aggregate Bond Index value to decline about 6%. However, the average yield to worst on the index has risen to 4.75% as of September 30 of this year. This higher income paid by the bonds helps offset the decline in bond values if interest rates continue to rise.
We continue to believe owning longer duration bonds may prove valuable if fears of a recession develop. Due to uncertainty surrounding the economic outlook over the next year, our targeted duration for fixed income portfolios is slightly shorter than our benchmark. In our view, U.S. investment grade bond valuations are very compelling for investors with a longer-term time horizon.
The Bottom Line
Inflation and its economic impacts have proven difficult to forecast, making it challenging for anyone to speculate where stock and bond markets are headed in the short term. Like the dog in Wanger’s analogy, the day-to-day news items can be unpredictable and exhausting at every turn. While we continue to pay close attention to the most recent economic data, we are laser focused on the path towards long-term success for our clients.
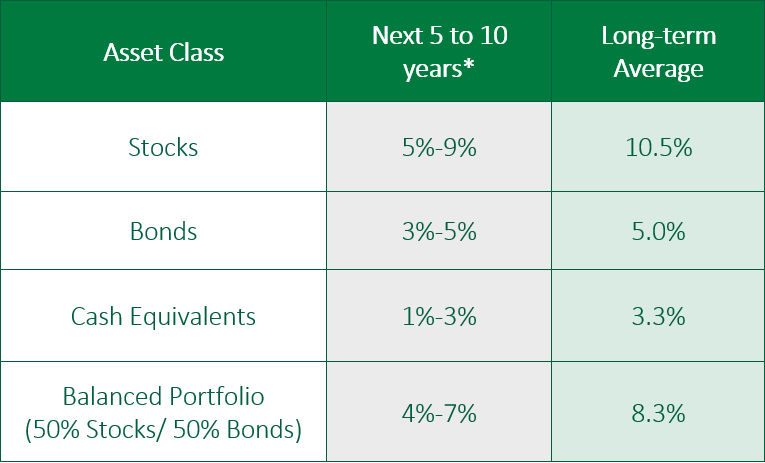 Figure 8
COUNTRY Trust Bank® Wealth Management Team
- Troy Frerichs, CFA - VP, Investment Services
- Jeff Hank, CFA, CFP® - Manager, Wealth Management
- G. Ryan Hypke, CFA, CFP® - Portfolio Manager
- Weston Chenoweth - Investment Analyst
- Beau Lartz - Investment Analyst
- Chelsie Moore, CFA, CFP® - Director, Wealth Management & Financial Planning
- Kent Anderson, CFA - Portfolio Manager
- Jonathan Strok, CFA - Portfolio Manager
- Samantha Reichert - Investment Analyst
- Cody Behrens - Investment Analyst
Looking for help navigating your future?
Set up a meeting with your local rep to review your current policies and make sure they're up to date. We pulled together some less obvious reasons to adjust your coverage.
COUNTRY Financial® is a family of affiliated companies (collectively, COUNTRY) located in Bloomington, IL. Learn more about who we are.
*Forecasted average annual returns of COUNTRY Trust Bank Wealth Management
Source: Morningstar and COUNTRY Trust Bank® - See Definitions and Important Information below
NOT FDIC-INSURED
May lose value
No bank guarantee
All information is as of the report date unless otherwise noted.
This material is provided for informational purposes only and should not be used or construed as investment advice or a recommendation of any security, sector, or investment strategy. All views expressed and forward-looking information, including forecasts and estimates, are based on the information available at the time of writing, do not provide a complete analysis of every material fact, and may change based on market or other conditions. Statements of fact are from sources considered reliable, but no representation or warranty is made as to their completeness or accuracy. Unless otherwise noted, the analysis and opinions provided are those of the COUNTRY Trust Bank investment team identified above and not necessarily those of COUNTRY Trust Bank or its affiliates.
Diversification, asset allocation and rebalancing do not assure a profit or guarantee against loss. All market indexes are unmanaged, and returns do not include fees and expenses associated with investing in securities. It is not possible to invest directly in an index.
Investment management, retirement, trust and planning services provided by COUNTRY Trust Bank®.
Past performance does not guarantee future results. All investing involves risk, including risk of loss.
Definitions and Important Information
Figures 1,2,3,4,5,6,7: Chart data comes from Refinitiv (formerly Thomson Reuters) DataStream, a powerful platform that integrates top-down macroeconomic research and bottom-up fundamental analysis.
Figure 8: The long-term average return data comes from Morningstar and is based upon compound average annual returns for the period from 1926 through December 31, 2021 Stocks are represented by the Ibbotson® Large Company Stock Index, which is comprised of the S&P 500® Composite Index from 1957 to present, and the S&P 90® Index from 1926 to 1956. Bonds are represented by the Ibbotson® U.S. Intermediate-Term Government Bond Index. Cash Equivalents are represented by the 30-day U.S. Treasury bill. The “Balanced Portfolio” is representative of an investment of 50% stocks and 50% bonds rebalanced annually. Forecasted stock returns include small capitalization and international equities. Forecasted bond returns include investment grade corporate bonds. These returns are for illustrative purposes and not indicative of actual portfolio performance. It is not possible to invest directly in an index.
The S&P 500® Index is an unmanaged index consisting of 500 large-cap U.S. stocks. Since it includes a significant portion of the total value of the market, it also considered representative of the market. The index does not reflect investment management fees, brokerage commission and other expenses associated with investing in equity securities. It is not possible to invest directly in an index.
Stocks of small-capitalization companies involve substantial risk. These stocks historically have experienced greater price volatility than stocks of larger companies, and they may be expected to do so in the future.
GDP or Gross Domestic Product is the monetary value of all goods and services produced during a specified period. The figure is used as a barometer of an economy’s health including its size and growth rate. In the U.S., quarterly GDP figures are typically “annualized” meaning the quarterly growth is compounded for four quarters.
The Bloomberg U.S. Aggregate Bond Index is an unmanaged index that covers the USD-denominated, investment-grade, fixed rate, taxable bond market of securities. The Index includes bonds from the Treasury, Government-Related, Corporate, MBS, ABS, and CMBS sectors.
The yield to worst (YTW) can be defined as the minimum yield that can be received on a bond, assuming the issuer doesn’t default on any of its payments. YTW particularly makes sense for bonds where the issuer exercises its options like calls, prepayments, or sinking funds.
A basis point is equal to one hundredth of one percent. It is used chiefly in expressing differences in interest rates.
The yield curve plots the interest rates of similar-quality bonds against their maturities. The most common yield curve plots the yields of U.S. Treasury securities for various maturities. An inverted yield curve occurs when short-term rates are higher than long-term rates.
iBoxx is a financial services division of IHS Markit that designs, calculates and distributes fixed income indices
The federal funds rate is the interest rate at which depository institutions lend reserve balances to other depository institutions overnight. The Federal Open Market Committee, which is the primary monetary policymaking body of the Federal Reserve, sets its desired target range
The price-to-earnings ratio is a valuation ratio which compares a company's current share price with its earnings per share (EPS). EPS is usually from the last four quarters (trailing P/E), but sometimes it can be derived from the estimates of earnings expected in the next four quarters (projected or forward P/E). The ratio is also sometimes known as "price multiple" or "earnings multiple."
The Consumer Price Index (CPI) measures the average change in prices over time that consumers pay for a basket of goods and services. Core CPI is the CPI subtracting energy and food prices.
PCE is an estimated total of personal consumption expenditures compiled by the U.S. government monthly as one way to measure and track changes in the prices of consumer goods over time. PCEs are household expenditures. PCEs as well as personal income statistics and the PCE Price Index are released monthly in the Bureau of Economic Analysis (BEA) Personal Income and Outlays report.
International investing involves risks not typically associated with domestic investing, including risks of adverse currency fluctuations, potential political and economic instability, different accounting standards, limited liquidity and volatile prices.
Fixed income securities are subject to various risks, including changes in interest rates, credit quality, market valuations, liquidity, prepayments, early redemption, corporate events, tax ramifications and other factors. Debt securities typically decrease in value when interest rates rise. The risk is usually greater for longer-term debt securities. Investments in lower-rated and nonrated securities present a greater risk of loss to principal and interest than higher- rated securities.