Market and Economic Outlook - Released 9/30/21
Key takeaways
- Uncertainty surrounding the COVID-19 pandemic, inflation and tax policy have been offset by accommodative central banks, an improving labor market and expectations for robust GDP growth in 2022.
- The U.S. stock market seems to be reflecting meaningful investor optimism, but we do believe pockets of opportunities still exist.
- Investment grade bonds have provided low correlated returns to stocks during times of market tumult, and we expect this to continue.
- Neither stocks nor bonds appear attractively valued. Because of this, investor returns over the next few years may be lower than historical averages.
Mark Twain once quipped, “October: This is one of the peculiarly dangerous months to speculate in stocks. The others are July, January, September, April, November, May, March, June, December, August and February.” This observation speaks to the inherent volatility which comes from investing in the stock market. Of course, as long-term investors, we are aware of the risks but also the higher potential returns for assuming that risk.
Uncertainty and Risk Prevalent
Uncertainty and risk seem to be prevalent in most conversations amongst our investment team lately. The COVID-19 pandemic continues to linger, impacting forecasts for economic growth, and moderating consumer confidence. A surge in consumer spending and supply chain bottlenecks have pushed inflation higher. The size and scope of a government spending bill and tax increases to pay for it is unsettled. Near quarter end, concerns about over indebted Chinese real estate developers concerned investors.
Global central banks have eased these concerns with their accommodative policies. Widespread job openings and tight inventory levels, which need to be replenished in many industries, should provide a tailwind to economic growth over at least the next year. The potential for 4%+ real GDP growth in 2022 is likely. In our view, these factors are likely to be supportive for financial markets.
Market Volatility Muted
Despite the risks we face today, the U.S. stock market has been relatively calm so far this year. Since 1980, the S&P 500 has averaged a drawdown of approximately 14% each year. During 2021, the largest decline from a market high has been near 5% (Figure 1). The lack of stock or bond market volatility is rare and has provided few chances to opportunistically buy investments at cheaper prices.
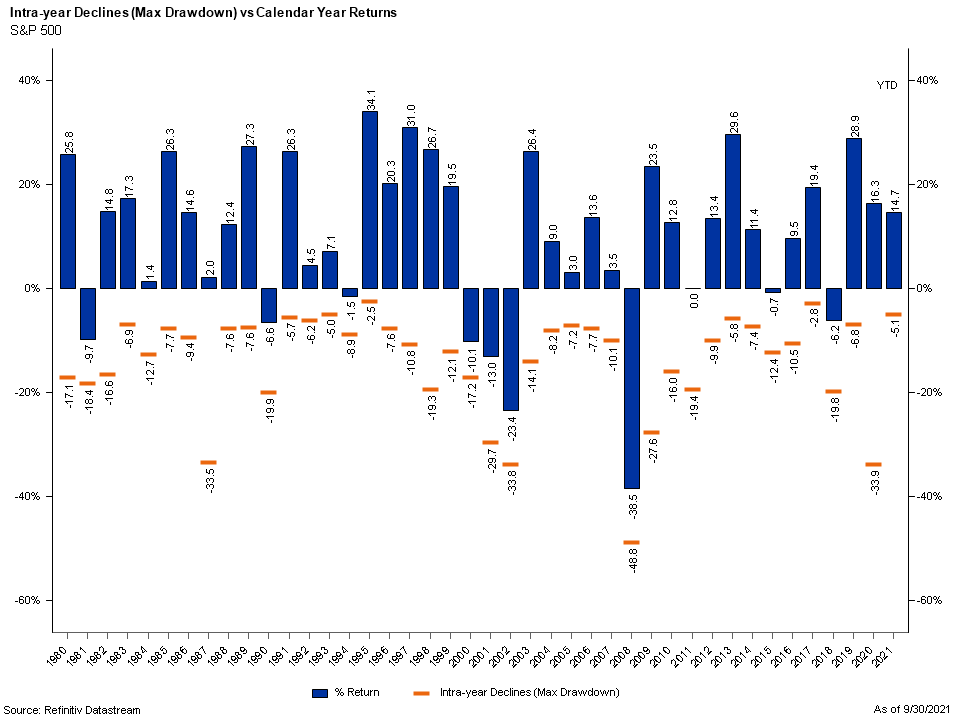 Figure 1
Inflation Remains a Concern
Inflation, and its long-term staying power, is a concern and could impact markets going forward. Inflation has been kept in check over the years by globalization, aging populations and technological innovations. It remains to be seen if the elevated inflation we are currently experiencing will be transitory, as the Federal Reserve believes, or longer lasting. Core CPI continues to be well above 2% (Figure 2).
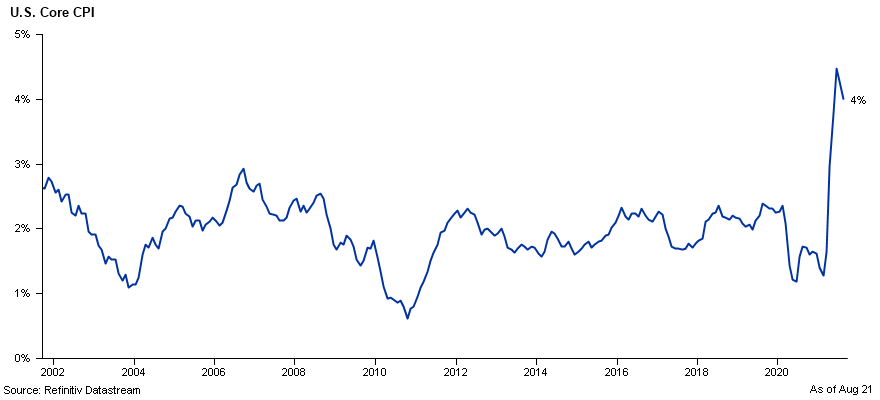 Figure 2
During 2022, supply chain disruptions should begin to normalize but labor supply continues to slow the recovery. Unemployment benefits, childcare responsibilities, lack of immigration and early retirements have all contributed to the labor shortage. Small businesses in manufacturing and distribution industries are having the most difficult time finding skilled workers. At the end of July, there were 10.9 million job openings in the U.S. per the Bureau of Labor Statistics, which is higher than the 8.4 million who were categorized as unemployed.
In this tight labor market, employers are considering increasing wages (Figure 3). Wage increases are likely to be sticky and can lead to longer lasting inflation pressures. We are monitoring the effects inflation may have on corporate earnings growth. It remains to be seen if rising input costs can be fully passed on to consumers. If they cannot be passed on at the same level costs rise, it would result in lower profit margins and earnings growth for businesses.
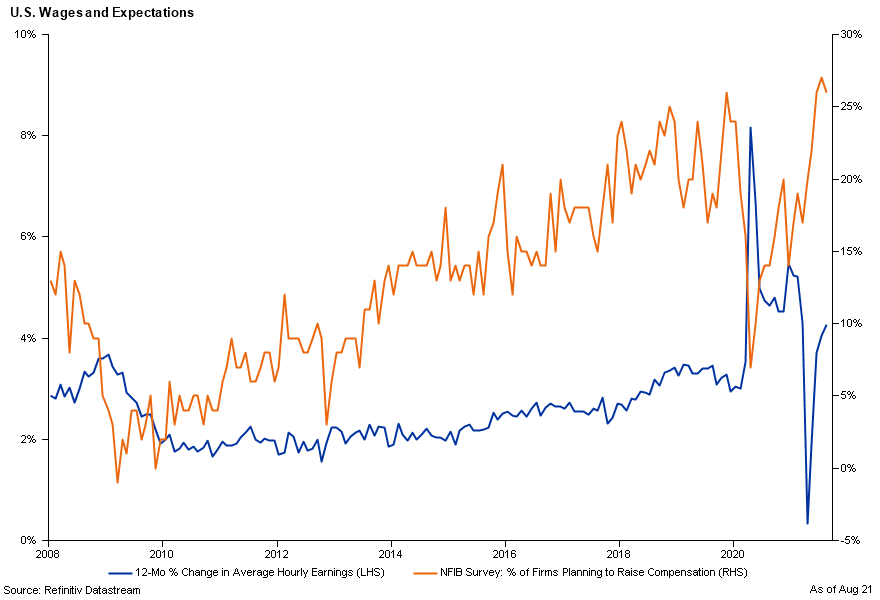 Figure 3
Catching up with Congress
Congress is currently negotiating a massive spending plan to provide additional fiscal stimulus. The Senate approved a $1 trillion infrastructure bill earlier this year with $550 billion in new federal spending and $450 billion renewing existing programs. Democratic lawmakers would prefer a larger spending package. At this point, no one knows what the final bill will include and what kind of tax law changes could be included to pay for it. There are currently many proposals which may impact personal income, corporate, inheritance, and capital gains tax rates. However, we caution against making investment moves based on speculation about tax law changes and would only adjust once the final details and timing is known.
The tax increases proposed aren’t likely to make much of a dent in the U.S. budget deficit and that continues to be a long-term concern. As long as the U.S. dollar is the world’s reserve currency, and interest rates remain low, the U.S. can afford to run large deficits. We believe higher levels of debt and deficits constrains economic growth and the ramifications of higher and higher levels of U.S. debt will play out over several years. The longer-term impacts may to lead to lower economic growth and investment returns. Those saving today for future goals likely need to account for this and implement in their long-term plan.
U.S. Stock Valuations Reflect Optimism
The U.S. stock market seems to be reflecting meaningful investor optimism and valuations remain elevated. Earnings growth has exceeded expectations so far this year supporting higher stock prices. We do believe pockets of opportunity still exist but continued strong earnings growth is needed to drive stock prices higher without valuations becoming further stretched. If earnings don’t meet expectations, on average, investors need to be willing to pay more per dollar of company earnings to support stocks at these levels.
Accommodative bond markets have given even the most distressed companies an opportunity to raise capital and improve their balance sheets locking in borrowing costs at record low rates. The result is corporate balance sheets are in excellent shape (Figure 4). Low interest rates can also positively impact stock valuations. A common method for determining value of a company’s stock is by discounting the timing and value of the company’s expected cash flows to the present using an interest rate. Lower interest rates translate to higher present value of future cash flows providing support for the stock price.
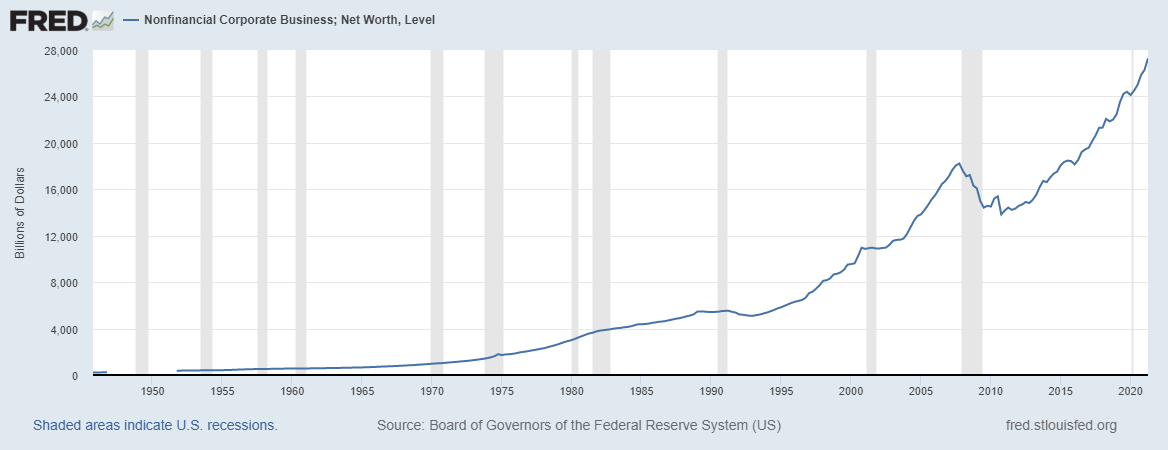 Figure 4
Above trend economic growth and consumer optimism could lead to strength in cyclical stocks, which are levered to an economic recovery. Given the more cyclical nature of non-U.S. stocks, we believe they look attractive relative to U.S. large caps, particularly if the global economic recovery continues. We feel non-U.S. stocks are attractively priced relative to their U.S. counterparts (Figure 5).
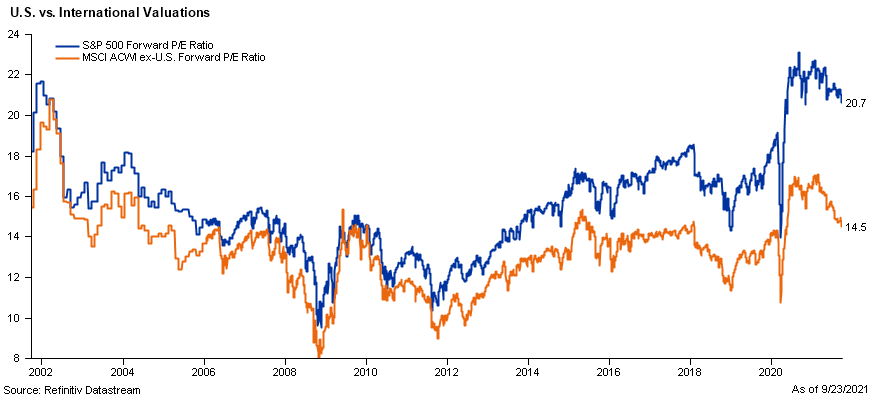 Figure 5
Federal Reserve Intervention
The Federal Reserve cut the federal funds rate in early 2020 to a range of 0-0.25%, expanded facilities to support bond markets and began buying U.S. Treasury and mortgage-backed securities. Over 18 months later, most of this emergency playbook is still in place. As a result of the Fed’s actions, yields for all type of bonds have plummeted to record lows. Most bonds don’t provide a positive real yield today (Figure 6).
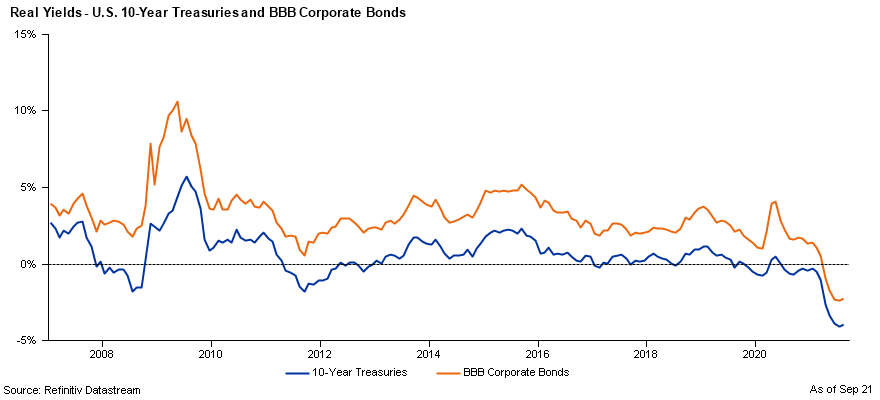 Figure 6
The Fed has stated they are likely to begin reducing their bond purchases later this year and we will monitor the impacts this could have on financial markets. However, we feel the Fed is unlikely to rush their tapering process and would pull back at the first sign of concerns from investors. The Fed’s most recent projections showed they are evenly split on whether it will be suitable to begin raising rates in late 2022. Even if the Personal Consumption Expenditures Price index, the Fed’s preferred inflation measure, rises above their 2% target, their average inflation targeting methodology provides flexibility to hold the federal funds rate at the current level.
Low interest rates have made it challenging to manage money in bonds. We feel the best strategy is to take advantage of every option available in a bond investors tool kit. Nontraditional fixed income sectors like bank loans, preferred stocks and emerging markets debt offer additional yield and diversification. They can introduce stock like volatility if the economic recovery falters, so we continue to monitor these positions in our client portfolios. If the economic recovery continues, as we expect, these positions should benefit.
Today, the primary reason to invest in bonds is for safety. Investment grade bonds have provided low correlated returns to stocks during times of market tumult, and we expect this to continue.
The Bottom Line
As we reflect on the prospects for our client portfolios, neither stocks nor bonds appear attractively valued. Because of this, investor returns over the next few years may be lower than historical averages. Nonetheless, we can’t lose sight of the fact investors need to maintain a long-term approach and we don’t believe it makes sense to chase higher returns in speculative investment categories.
While risks are prevalent today, we believe staying fully invested provides the best opportunity for our clients to meet their long-term goals. We strongly believe in the value of a financial plan to navigate the possibility of a low return environment. After all Mark Twain also said, “You should plan for your future because that is where you are going to spend the rest of your life!” A trusted financial professional can be vital to developing and implementing that plan.
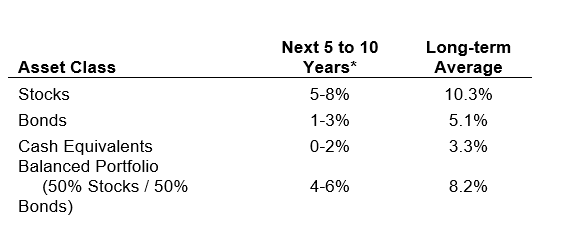 Figure 7
* Forecasted average annual returns of COUNTRY Trust Bank Wealth Management
Source: Morningstar and COUNTRY Trust Bank – See important information below
COUNTRY Trust Bank wealth management team
- Troy Frerichs, CFA - VP, Investment Services
- Jeff Hank, CFA, CFP® - Manager, Wealth Management
- G. Ryan Hypke, CFA, CFP® - Portfolio Manager
- Weston Chenoweth - Investment Analyst
- Molly Ruddy - Investment Analyst
- Chelsie Moore, CFA, CFP® - Director, Wealth Management & Financial Planning
- Kent Anderson, CFA - Portfolio Manager
- Jonathan Strok, CFA - Portfolio Manager
- Jamie Czesak - Investment Analyst
Looking for help navigating your future?
Set up a meeting with your local rep to review your current policies and make sure they're up to date. We pulled together some less obvious reasons to adjust your coverage.
COUNTRY Financial® is a family of affiliated companies (collectively, COUNTRY) located in Bloomington, IL. Learn more about who we are.
NOT FDIC-INSURED
May lose value
No bank guarantee
All information is as of the report date unless otherwise noted.
This material is provided for informational purposes only and should not be used or construed as investment advice or a recommendation of any security, sector, or investment strategy. All views expressed and forward-looking information, including forecasts and estimates, are based on the information available at the time of writing, do not provide a complete analysis of every material fact, and may change based on market or other conditions. Statements of fact are from sources considered reliable, but no representation or warranty is made as to their completeness or accuracy. Unless otherwise noted, the analysis and opinions provided are those of the COUNTRY Trust Bank investment team identified above and not necessarily those of COUNTRY Trust Bank or its affiliates.
Diversification, asset allocation and rebalancing do not assure a profit or guarantee against loss. All market indexes are unmanaged, and returns do not include fees and expenses associated with investing in securities. It is not possible to invest directly in an index.
Investment management, retirement, trust and planning services provided by COUNTRY Trust Bank®.
Past performance does not guarantee future results. All investing involves risk, including risk of loss.
Definitions and Important Information
Figures 1,2,3,5,6: Chart data comes from Refinitiv (formerly Thomson Reuters) DataStream, a powerful platform that integrates top-down macroeconomic research and bottom-up fundamental analysis.
Figures 4: Chart data comes from Federal Reserve of St. Louis Economic Database (FRED). It has more than 765,000 economic time series from 96 sources. They cover banking, business/fiscal, consumer price indexes, employment and population, exchange rates, gross domestic product, interest rates, monetary aggregates, producer price indexes, reserves and monetary base, U.S. trade and international transactions, and U.S. financial data. The time series are compiled by the Federal Reserve and many are collected from government agencies such as the U.S. Census and the Bureau of Labor Statistics.
Figure 7: The long-term average return data comes from Morningstar and is based upon compound average annual returns for the period from 1926 through December 31, 2020 Stocks are represented by the Ibbotson® Large Company Stock Index, which is comprised of the S&P 500® Composite Index from 1957 to present, and the S&P 90® Index from 1926 to 1956. Bonds are represented by the Ibbotson® U.S. Intermediate-Term Government Bond Index. Cash Equivalents are represented by the 30-day U.S. Treasury bill. The “Balanced Portfolio” is representative of an investment of 50% stocks and 50% bonds rebalanced annually. Forecasted stock returns include small capitalization and international equities. Forecasted bond returns include investment grade corporate bonds. These returns are for illustrative purposes and not indicative of actual portfolio performance. It is not possible to invest directly in an index.
The S&P 500® Index is an unmanaged index consisting of 500 large-cap U.S. stocks. Since it includes a significant portion of the total value of the market, it also considered representative of the market. The index does not reflect investment management fees, brokerage commission and other expenses associated with investing in equity securities. It is not possible to invest directly in an index.
GDP or Gross Domestic Product is the monetary value of all goods and services produced during a specified period. The figure is used as a barometer of an economy’s health including its size and growth rate. In the U.S., quarterly GDP figures are typically “annualized” meaning the quarterly growth is compounded for four quarters.
The federal funds rate is the interest rate at which depository institutions lend reserve balances to other depository institutions overnight. The Federal Open Market Committee, which is the primary monetary policymaking body of the Federal Reserve, sets its desired target range.
The real rate of return is the return on an investment after adjusting for inflation. It is calculated by taking the gross return after subtracting the inflation rate.
A basis point is equal to one hundredth of one percent. It is used chiefly in expressing differences in interest rates.
The yield curve plots the interest rates of similar-quality bonds against their maturities. The most common yield curve plots the yields of U.S. Treasury securities for various maturities. An inverted yield curve occurs when short-term rates are higher than long-term rates.
The Morgan Stanley Capital International All Country World Index Ex-U.S. (MSCI ACWI Ex-U.S.) is a market-capitalization-weighted index maintained by Morgan Stanley Capital International (MSCI). It is designed to provide a broad measure of stock performance throughout the world, except for U.S.-based companies. The MSCI ACWI Ex-U.S. includes both developed and emerging markets.
The price-to-earnings ratio is a valuation ratio which compares a company's current share price with its earnings per share (EPS). EPS is usually from the last four quarters (trailing P/E), but sometimes it can be derived from the estimates of earnings expected in the next four quarters (projected or forward P/E). The ratio is also sometimes known as "price multiple" or "earnings multiple."
Stocks of small-capitalization companies involve substantial risk. These stocks historically have experienced greater price volatility than stocks of larger companies, and they may be expected to do so in the future.
The Consumer Price Index (CPI) measures the average change in prices over time that consumers pay for a basket of goods and services. Core CPI is the CPI subtracting energy and food prices.
International investing involves risks not typically associated with domestic investing, including risks of adverse currency fluctuations, potential political and economic instability, different accounting standards, limited liquidity and volatile prices.
The BBB rating is a credit rating used by S&P and Fitch credit rating agencies for long term bonds and some other investments. It is equivalent to the Baa2 rating used by Moody’s. A BBB rating represents a relatively low risk bond or investment. However, it is toward the bottom of investment grade bond ratings, being only two grades above junk bond ratings.
The Personal Consumption Expenditures Price index is a nation-wide indicator of the average increase in prices for all domestic personal consumption. It's indexed to a base of 100 in 1992. It's derived from the largest Gross Domestic Product component, personal consumption expenditures.
Fixed income securities are subject to various risks, including changes in interest rates, credit quality, market valuations, liquidity, prepayments, early redemption, corporate events, tax ramifications and other factors. Debt securities typically decrease in value when interest rates rise. The risk is usually greater for longer-term debt securities. Investments in lower-rated and nonrated securities present a greater risk of loss to principal and interest than higher- rated securities.