Market and Economic Outlook - Released 6/30/21
Key takeaways
- Our base case scenario is for a strong economic recovery over the next 12 months. Leading economic indicators are elevated, the job market continues to improve, consumer balance sheets are in great shape, and there is pent-up demand to spend.
- U.S. stock valuations as measured by forward P/E ratios of the S&P 500 are elevated but we expect corporate earnings revisions to move higher during 2021.
- Bond investors must continue to balance the risk of rising interest rates and pushing too far out on the risk spectrum to pick up additional yield.
“Summertime, and the livin’ is easy” are the opening lyrics of the classic song, “Summertime,” originally composed by George Gershwin. As the developed world begins to emerge from the COVID-19 pandemic, the summer of 2021 is starting to feel normal again. We are taking vacations, attending concerts, and packing baseball stadiums to cheer on our favorite teams. Optimism surrounding the reopening is abundant and the forecast for the next few quarters of U.S. economic growth is bright and sunny.
However, the conditions for investors today are anything but easy. Global stock markets have rallied significantly, and their valuations remain near all-time highs. Interest rates continue to remain near record lows, providing little if any yield above the rate of inflation.
Economic Recovery Continues
Our base case scenario is for a strong economic recovery over the next 12 months. Leading economic indicators are elevated, the job market continues to improve, consumer balance sheets are in great shape, and there is pent-up demand to spend. While a lot of this good news is priced into stocks, in our view, it is still not an environment to be underweight or neutral stocks relative to bonds. While stock market pullbacks are common each year, bear markets are rare outside of recessions. Given the strong economic fundamentals coupled with fiscal stimulus still working its way through the economy, we maintain an overweight to stocks vs. bonds in multi-asset portfolios.
The worst of the pandemic seems to be in the rearview mirror. According to data from the U.S. government, over 50% of Americans have received at least 1 dose of a coronavirus vaccine and case growth rates continue to fall. We believe this supports plenty of runway in this economic recovery, and as a result corporate earnings growth is likely to be strong for quite some time. However, tremendous consumer demand paired with supply chain and labor constraints is leading to inflation concerns.
Inflation on our Radar
We do believe inflation, both realized and expected, will continue to be an increasingly important storyline over the coming months and is something to monitor. There is a risk the economy will not grow as robustly due to supply chain issues. However, we believe it is preferred for an economy to have a short-term supply disruption instead of a long-term lack of demand for goods and services. At this point, we believe the supply disruptions are temporary and we have seen commodity prices, such as lumber, leveling off in recent weeks (Figure 1). It is easier to shut down an economy than to restart one and it isn’t surprising glitches have occurred.
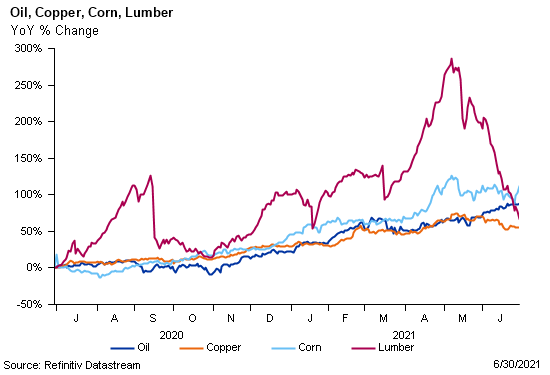 Figure 1
The employment outlook continues to be favorable. Many businesses are hiring as seen by the total number of jobs available now is greater than the total number of unemployed Americans (Figure 2).
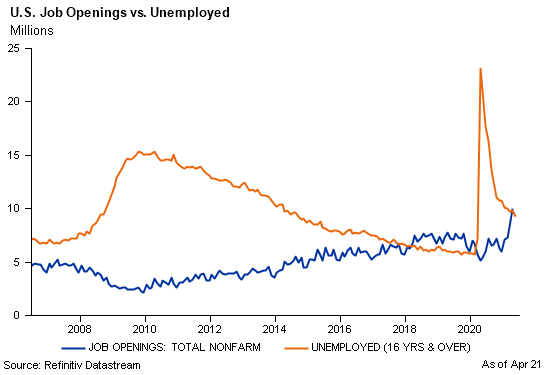 Figure 2
According to the Labor Department, the quit rate, the rate at which employees voluntarily leave their jobs, is near the highest levels since the government began measuring this data. Companies are likely to pay more to attract workers and wages tend to be sticky which eventually may float to costs being passed on to the consumer. This wage pressure could lead to longer term inflation concerns. Potentially mitigating these wage pressures are secular forces like an aging population, technological advancements, and globalization as they are deflationary.
A critical question is: how long will the Federal Reserve let the economy run before inflation becomes difficult to control? For now, the Fed believes the inflation pressures are transitory and are primarily due to supply chain issues. The Fed has adopted flexible average inflation targeting and is willing to work with fiscal policy to allow their inflation target to move above 2% for a period. While we think inflation will not spiral out of control, the risk is elevated due to these supply chain disruptions, wage pressures, and accommodative monetary & fiscal policy stances.
During a period of heightened concerns about inflation risk, many clients inquire about adding gold and other precious metals or, in recent years, cryptocurrency to their portfolio. It is important to note gold and cryptocurrency generates no revenues or earnings like a business. With limited exceptions in cryptocurrency, they also do not pay interest or dividends. Month to month, gold prices and cryptocurrency prices demonstrate no clear relationship to inflation and the volatility of both investments can make them a poor protector against inflation over longer periods of time. To make money, you are betting someone will pay a higher price than you did for the investment. If inflation is likely to accelerate longer term, a broadly diversified commodities fund may generally be attractive. However, for now we believe a diversified portfolio across asset classes, consistent with an investor’s risk tolerance, to be the best approach to navigating inflation and other market risks.
Stock Valuations are Elevated
U.S. stock valuations as measured by forward P/E ratios of the S&P 500 are elevated (Figure 3).
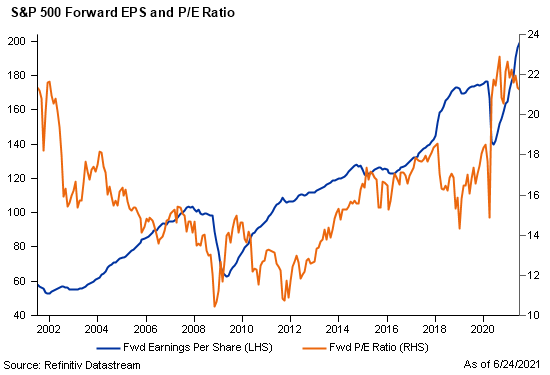 Figure 3
The forward-looking P/E is above the 20-year average, but we expect corporate earnings revisions to move higher during 2021. Estimates out to 2022 and 2023 are looking at double digit corporate earnings growth as analysts have high forecasts of earnings going well above expectations. If market expectations are not met, stock prices could correct. It is likely legislation to raise the corporate business tax rate will be introduced over the next few months. Uncertainty from changing tax laws may impact stock valuations. It remains to be seen if higher taxes will reduce earnings or get passed through in the form of price increases. Companies have become more efficient in the post COVID world. Rising earnings expectations, better profitability and low interest rates may support higher valuations for U.S. stocks despite potential headwinds from tax law changes.
Non-US stocks as measured by the MSCI ACWI ex USA Index still appear cheap relative to their U.S. counterparts and the major developed markets currently have higher dividend yields (Figure 4). Non-U.S. stocks make up nearly half of the value of all stocks worldwide. Sector composition is different than U.S. markets with heavier exposure to cyclical industries. Exposure to foreign currencies adds another layer of diversification. For these reasons, we believe international stocks are attractive.
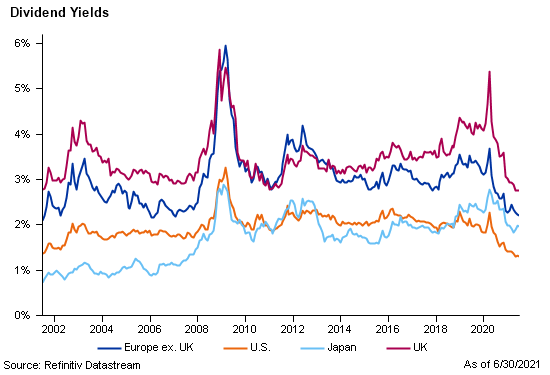 Figure 4
Small cap stocks have led the U.S. stock market higher over the last year but speculation in low quality names continues in small caps. Trading volumes continue to be high in “meme stocks”, which trade more heavily, because of hype on social media and online forums. However, it seems to be more headline risk than impacting actual fundamentals. The sharp economic recovery benefits small caps since they are more leveraged to the domestic economy.
Bond Yields Remain Challenged
While stocks don’t appear cheap, conditions in the bond market continue to be challenged by low yields. U.S. Treasury rates moved higher during the 1st quarter but have grinded sideways since. Robust demand appears to be putting a ceiling on interest rates. Higher rates have resulted in negative investment grade bond index returns so far this year, but this hasn’t deterred fixed income buyers. So far this year, net fund flows into bond funds and ETFs are strong (Figure 5) despite low interest rates. Corporate pension plans, insurance companies, foreign investors and retirees are flush with cash and are seeking safe income producing assets.
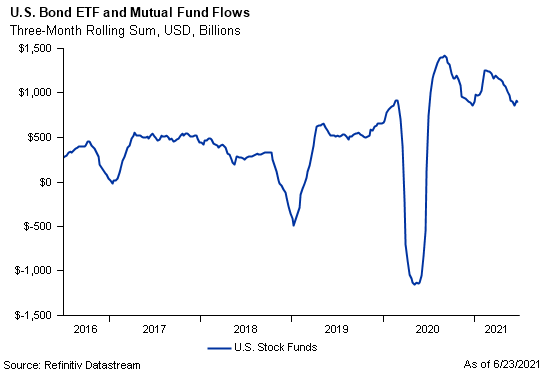 Figure 5
Additional yield is hard to come by if an investor chooses to take credit risk in corporate bonds. The difference between BBB rated corporate bond yields and Treasury rates have continued to tighten this year (Figure 6). In fact, the option adjusted spreads, or the difference in rates taking into consideration any option in the bonds, are at the lowest levels in the last 10 years. Yields on high yield or junk bonds as measured by the Bloomberg Barclays U.S. High Yield Index are at the lowest rates ever.
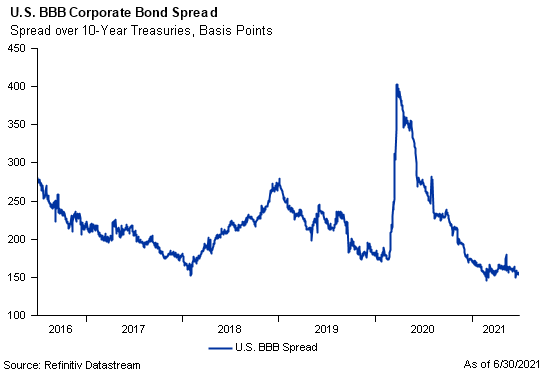 Figure 6
Bond investors must continue to balance the risk of rising interest rates and pushing too far out on the risk spectrum to pick up additional yield. We have been correct in our belief interest rates aren’t heading meaningfully higher. However, we believe it makes sense to position bond portfolios with a slightly shorter duration than our benchmark, if rates resume their increase, given the threat of higher inflation.
We feel areas of opportunity within fixed income do exist in preferred stocks, floating-rate loans, and emerging market debt. These types of investments are leveraged to an improving economy and earn higher yields than investment grade bonds, though they will not provide the stability of higher quality bonds during volatile periods. Even though yields are not attractive in investment grade bonds today, they have proven their worth in times of stock market stress.
The Bottom Line
We believe economic growth will continue during the 2nd half of 2021. This backdrop is likely to remain positive for financial markets, but the risks of increasing inflation are not to be ignored. While we believe neither stock nor bond markets appear attractively priced, the environment remains favorable for risk assets. Given the current levels of stock and bond valuations today, investors could be forced to face the music of lower returns going forward. If that is the case, developing a plan with a trusted financial professional is critical for the peace of mind required to enjoy those lazy summer days of the future.
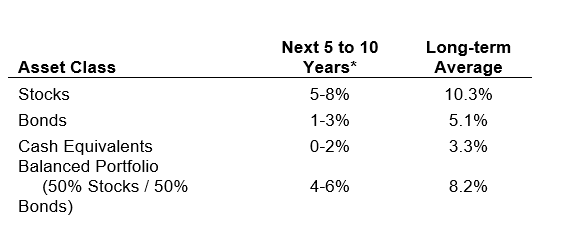 Figure 7
* Forecasted average annual returns of COUNTRY Trust Bank Wealth Management
Source: Morningstar and COUNTRY Trust Bank – See important information below
COUNTRY Trust Bank wealth management team
- Troy Frerichs, CFA - VP, Investment Services
- Jeff Hank, CFA, CFP® - Manager, Wealth Management
- G. Ryan Hypke, CFA, CFP® - Portfolio Manager
- Weston Chenoweth - Investment Analyst
- Molly Ruddy - Investment Analyst
- Chelsie Moore, CFA, CFP® - Director, Wealth Management & Financial Planning
- Kent Anderson, CFA - Portfolio Manager
- Jonathan Strok, CFA - Portfolio Manager
- Jamie Czesak - Investment Analyst
Looking for help navigating your future?
Set up a meeting with your local rep to review your current policies and make sure they're up to date. We pulled together some less obvious reasons to adjust your coverage.
COUNTRY Financial® is a family of affiliated companies (collectively, COUNTRY) located in Bloomington, IL. Learn more about who we are.
NOT FDIC-INSURED
May lose value
No bank guarantee
All information is as of the report date unless otherwise noted.
This material is provided for informational purposes only and should not be used or construed as investment advice or a recommendation of any security, sector, or investment strategy. All views expressed and forward-looking information, including forecasts and estimates, are based on the information available at the time of writing, do not provide a complete analysis of every material fact, and may change based on market or other conditions. Statements of fact are from sources considered reliable, but no representation or warranty is made as to their completeness or accuracy. Unless otherwise noted, the analysis and opinions provided are those of the COUNTRY Trust Bank investment team identified above and not necessarily those of COUNTRY Trust Bank or its affiliates.
Diversification, asset allocation and rebalancing do not assure a profit or guarantee against loss. All market indexes are unmanaged, and returns do not include fees and expenses associated with investing in securities. It is not possible to invest directly in an index.
Investment management, retirement, trust and planning services provided by COUNTRY Trust Bank®.
Past performance does not guarantee future results. All investing involves risk, including risk of loss.
Definitions and Important Information
Figures 1,2,3,4,5,6: Chart data comes from Refinitiv (formerly Thomson Reuters) DataStream, a powerful platform that integrates top-down macroeconomic research and bottom-up fundamental analysis.
Figure 7: The long-term average return data comes from Morningstar and is based upon compound average annual returns for the period from 1926 through December 31, 2020 Stocks are represented by the Ibbotson® Large Company Stock Index, which is comprised of the S&P 500® Composite Index from 1957 to present, and the S&P 90® Index from 1926 to 1956. Bonds are represented by the Ibbotson® U.S. Intermediate-Term Government Bond Index. Cash Equivalents are represented by the 30-day U.S. Treasury bill. The “Balanced Portfolio” is representative of an investment of 50% stocks and 50% bonds rebalanced annually. Forecasted stock returns include small capitalization and international equities. Forecasted bond returns include investment grade corporate bonds. These returns are for illustrative purposes and not indicative of actual portfolio performance. It is not possible to invest directly in an index.
The S&P 500® Index is an unmanaged index consisting of 500 large-cap U.S. stocks. Since it includes a significant portion of the total value of the market, it also considered representative of the market. The index does not reflect investment management fees, brokerage commission and other expenses associated with investing in equity securities. It is not possible to invest directly in an index.
GDP or Gross Domestic Product is the monetary value of all goods and services produced during a specified period of time. The figure is used as a barometer of an economy’s health including its size and growth rate. In the U.S., quarterly GDP figures are typically “annualized” meaning the quarterly growth is compounded for four quarters.
The federal funds rate is the interest rate at which depository institutions lend reserve balances to other depository institutions overnight. The Federal Open Market Committee, which is the primary monetary policymaking body of the Federal Reserve, sets its desired target range.
A basis point is equal to one hundredth of one percent. It is used chiefly in expressing differences in interest rates.
The yield curve plots the interest rates of similar-quality bonds against their maturities. The most common yield curve plots the yields of U.S. Treasury securities for various maturities. An inverted yield curve occurs when short-term rates are higher than long-term rates.
The BBB rating is a credit rating used by S&P and Fitch credit rating agencies for long term bonds and some other investments. It is equivalent to the Baa2 rating used by Moody’s. A BBB rating represents a relatively low risk bond or investment. However, it is toward the bottom of investment grade bond ratings, being only two grades above junk bond ratings.
The price-to-earnings ratio is a valuation ratio which compares a company's current share price with its earnings per share (EPS). EPS is usually from the last four quarters (trailing P/E), but sometimes it can be derived from the estimates of earnings expected in the next four quarters (projected or forward P/E). The ratio is also sometimes known as "price multiple" or "earnings multiple."
Stocks of small-capitalization companies involve substantial risk. These stocks historically have experienced greater price volatility than stocks of larger companies, and they may be expected to do so in the future.
International investing involves risks not typically associated with domestic investing, including risks of adverse currency fluctuations, potential political and economic instability, different accounting standards, limited liquidity and volatile prices.
Fixed income securities are subject to various risks, including changes in interest rates, credit quality, market valuations, liquidity, prepayments, early redemption, corporate events, tax ramifications and other factors. Debt securities typically decrease in value when interest rates rise. The risk is usually greater for longer-term debt securities. Investments in lower-rated and nonrated securities present a greater risk of loss to principal and interest than higher-rated securities.