Market and Economic Outlook - Released 6/30/20
Key takeaways
- Stimulus measures from Congress and the Federal Reserve have narrowed the range of economic uncertainty but we believe the future course for the economy remains far from predictable.
- The S&P 500 has outperformed other world stock markets year to date primarily due to its heavier weighting in the technology sector.
- The Fed’s purchases of corporate bonds in addition to Treasury and agency mortgage backed securities has provided support to fixed income markets.
- Given the rally during the second quarter, we now feel it makes sense to return to a neutral stance between stocks and bonds within multi asset portfolios.
Investing can often feel like a roller coaster with twists and turns and sometimes even stomach-churning ups and downs. It certainly has been quite the thrill ride in financial markets so far this year.
The effects of the economic shutdown to fight the COVID-19 virus are still being felt on Main Street. However, Wall Street turned its attention to possible vaccines, therapies, and an aggressive Federal Reserve. While it may not be possible to go on a thrill ride at a theme park or your local county fair this summer, investors are likely dizzy tracking the value of their portfolios the last few months.
Following March’s panic selling, we witnessed a robust financial market recovery during the 2nd quarter which exceeded our expectations through June 30th (Figure 1). The S&P 500 rallied 35% from the March 23rd low through June 30th after a decline of 34% in just over a month starting February 19th.
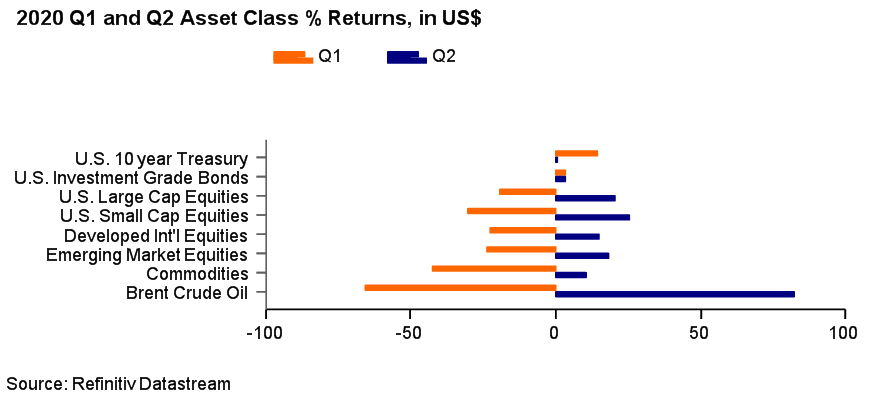 Figure 1
The harrowing decline, and subsequent rebound in the S&P 500, has inversely tracked the weekly percentage change in U.S. new COVID-19 virus cases as of June 30th (Figure 2).
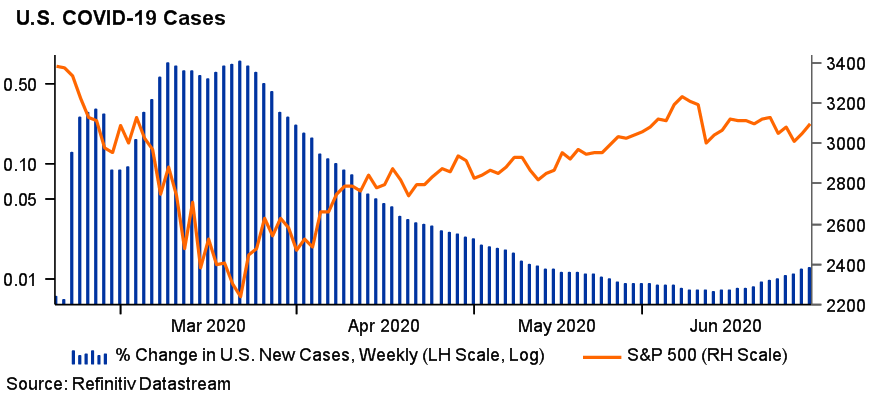 Figure 2
Federal Reserve restores confidence
A major reason for the sharp bounce is the unprecedented actions by global central banks including the Federal Reserve. The Fed has implemented 16 different programs including cutting the Fed funds rate since March and their balance sheet has expanded significantly through June 30th (Figure 3). They have succeeded so far in restoring confidence to the markets and enabling credit to flow freely. While the Fed’s actions have narrowed the range of uncertainty, we still believe the future course for the economy remains far from predictable and note risks remain elevated.
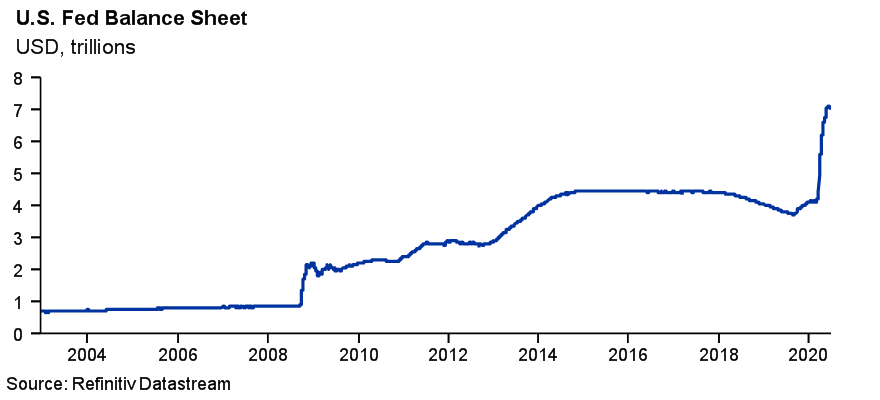 Figure 3
A key question is if the negative snowball effect of higher unemployment will lead to reduced demand and weakness in corporate profits. Demand in industries like airlines, travel and tourism and energy may take years to recover to pre-2020 levels. This may have negative effects down the supply chain as well as significantly impacting jobs and incomes for years to come.
Fiscal policy has also benefited the markets as Congress passed 4 different major pieces of legislation. This stimulus has included a variety of loan programs, direct payments and tax credits. The response to the virus has been large, but we are concerned how we will pay for all of this. Long-term, the huge stimulus packages put in place in the U.S. and other countries could eventually lead to inflation. Exploding deficits and debt issuance could be inflationary as the government is forced to print money to pay the debt. While inflation certainly is a risk we may face, we believe it will be years away before it’s significant. A major determinant of inflation is how often money is exchanged in an economy. Currently, this rate is low partly due to curtailed consumer spending and is the primary reason why inflation has remained contained.
U.S. stock market led by technology
When discussing the stock market rally, it is important to make a distinction between the haves and have nots. The S&P 500 has performed exceptionally well relative to other world stock markets partly due to its weighting in giant technology companies. However, “FANG” stocks, or four popular U.S. technology companies, Facebook, Amazon, Netflix and Alphabet (commonly known as Google) have significantly outperformed the S&P 500 through June 30th (Figure 4). These firms, which have become essential to our daily lives, benefited from the economic shutdown. In fact, the top 5 names in the S&P 500 which includes Microsoft, Apple, Amazon, Facebook and Alphabet now make up more than 20% of the market capitalization of the entire index. The S&P 500 wasn’t even this concentrated during the 1990s technology bubble. This concerns us and we fear the U.S. equity market has gotten ahead of itself.
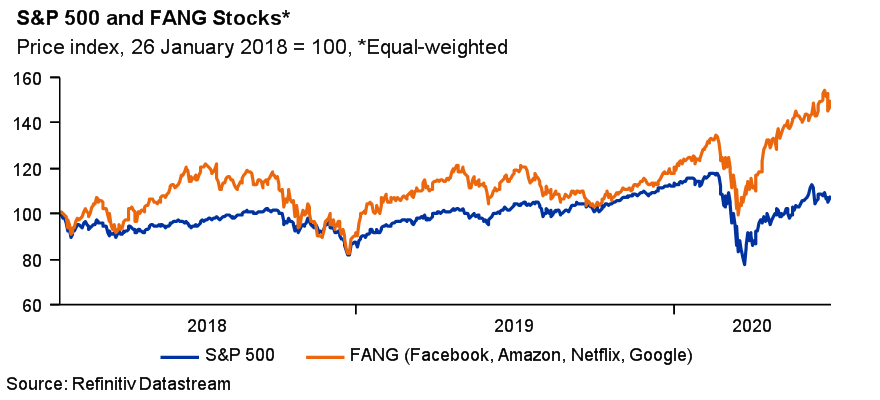 Figure 4
While international markets have not recovered to the same degree, much of that is explained by the economic sector mix, as U.S. markets have a much greater allocation to technology companies. We still believe emerging markets have potential due to their attractive demographics, growth characteristics and current valuations. However, we are concerned about rising COVID-19 infection rates in pockets of these regions. This gives us pause, and the short term could be volatile, as those countries may have difficulty dealing with shutdowns to combat the virus. For now, the market seems to have put trade issues with China on the backburner. However, recent tensions with China regarding Hong Kong could flare up later this year. If this happens, we will be watching to see how global supply chains change and how it ripples through the economy.
Stocks in the small cap universe are more heavily weighted in sectors like finance, industrials, energy and materials and are more attractively priced on a relative basis. We believe these cyclical sectors could shine as the economy restarts. We continue to like the relative attractiveness of U.S. small cap stocks.
Bonds recover
Bond markets also experienced a recovery during the quarter. The Fed’s impact on markets was felt in early April as many of the market dislocations from March evaporated. The difference in interest rates, or spreads, corporations pay over the U.S. Treasury rate declined significantly during the quarter. For example, BBB rated corporate bond spreads hit a high of +403 basis points (or 4.03%) on March 23rd and steadily declined through June 30th (Figure 5). The Fed’s actions have included buying corporate bonds in addition to Treasury and agency mortgage backed securities sending a signal to markets they may act as the buyer of last resort for many types of bonds.
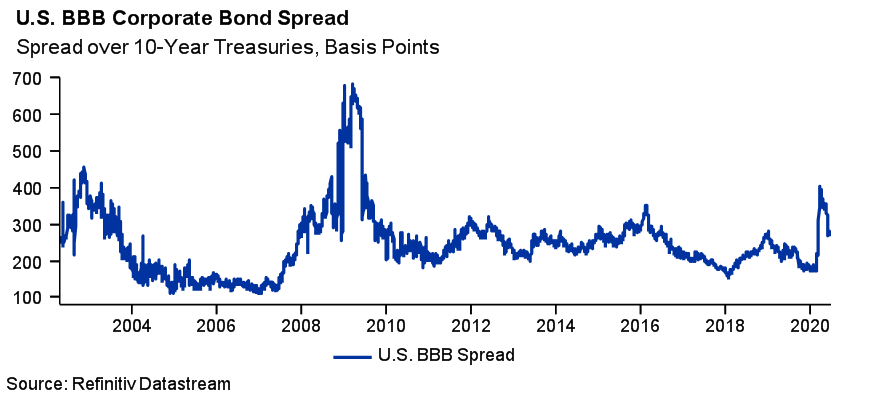 Figure 5
Interest rates are likely to remain low for years to facilitate the economic recovery and to make it easier for the U.S. to service its debt. This is a great situation for companies and individuals, providing cheap financing, but makes it difficult for investors seeking yield. With the 10-year Treasury yield still firmly below 1%, and the Fed signaling it won’t raise rates anytime soon, the forecast for bond returns remains low.
Today, high quality bonds are primarily owned not for return, but for stability during the next unforeseen event. Investors are forced to take risk in bonds to earn returns above inflation. Many investment grade taxable bonds yield less than 2% today which is in line with current expectations for inflation the next few years. We do continue to see value in some areas including non-traditional income producing asset classes like preferred stocks and floating rate loans.
The bottom line
At the start of 2020, we remained cautious and didn’t see compelling value in stocks or bonds. The selloff in all types of investments due to uncertainties surrounding the shutdown of the economy created a small window of opportunity.
During mid to late March, both stocks and bonds became attractively valued in our estimation. However, given the rally during the quarter, we now feel it makes sense to return to a neutral stance between stocks and bonds within multi asset portfolios. As active investors, the roller coaster ride gets us excited, creating opportunities during those steep short-term drops. The ride is likely to remain bumpy through year end. As states begin to reopen, it is likely to cause COVID-19 infection rates to increase in certain regions. We believe the best course currently is to take a measured approach in our accounts. In our view, the key tenets of diversification and remaining fully invested can help keep long-term goals on track for our investment objectives.
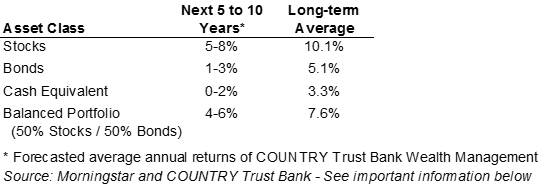 Figure 6
COUNTRY Trust Bank wealth management team
- Troy Frerichs, CFA - VP, Investment Services
- Jeff Hank, CFA, CFP® - Manager, Wealth Management
- Jonathan Strok, CFA - Portfolio Manager
- Jamie Czesak - Investment Analyst
- Chelsie Moore, CFA, CFP® - Director, Wealth Management & Financial Planning
- Kent Anderson, CFA - Portfolio Manager
- Weston Chenoweth - Investment Analyst
- Molly Ruddy - Investment Analyst
Looking for help navigating your future?
Set up a meeting with your local rep to review your current policies and make sure they're up to date. We pulled together some less obvious reasons to adjust your coverage.
COUNTRY Financial® is a family of affiliated companies (collectively, COUNTRY) located in Bloomington, IL. Learn more about who we are.
NOT FDIC-INSURED
May lose value
No bank guarantee
All information is as of the report date unless otherwise noted.
This material is provided for informational purposes only and should not be used or construed as investment advice or a recommendation of any security, sector, or investment strategy. All views expressed and forward-looking information, including forecasts and estimates, are based on the information available at the time of writing, do not provide a complete analysis of every material fact, and may change based on market or other conditions. Statements of fact are from sources considered reliable, but no representation or warranty is made as to their completeness or accuracy. Unless otherwise noted, the analysis and opinions provided are those of the COUNTRY Trust Bank investment team identified above and not necessarily those of COUNTRY Trust Bank or its affiliates.
Diversification, asset allocation and rebalancing do not assure a profit or guarantee against loss. All market indexes are unmanaged, and returns do not include fees and expenses associated with investing in securities. It is not possible to invest directly in an index.
Investment management, retirement, trust and planning services provided by COUNTRY Trust Bank®.
Past performance does not guarantee future results. All investing involves risk, including risk of loss.
Definitions and Important Information
Figures 1,2,3,4,5: Chart data comes from Refinitiv (formerly Thomson Reuters) Datastream, a powerful platform that integrates top-down macroeconomic research and bottom-up fundamental analysis.
Figure 6: The long-term average return data comes from Morningstar and is based upon compound average annual returns for the period from 1926 through December 31, 2019. Stocks are represented by the Ibbotson® Large Company Stock Index, which is comprised of the S&P 500® Composite Index from 1957 to present, and the S&P 90® Index from 1926 to 1956. Bonds are represented by the Ibbotson® U.S. Intermediate-Term Government Bond Index. Cash Equivalents are represented by the 30-day U.S. Treasury bill. The “Balanced Portfolio” is representative of an investment of 50% stocks and 50% bonds rebalanced annually. Forecasted stock returns include small capitalization and international equities. Forecasted bond returns include investment grade corporate bonds. These returns are for illustrative purposes and not indicative of actual portfolio performance. It is not possible to invest directly in an index.
The S&P 500® Index is an unmanaged index consisting of 500 large-cap U.S. stocks. Since it includes a significant portion of the total value of the market, it also considered representative of the market. The index does not reflect investment management fees, brokerage commission and other expenses associated with investing in equity securities. It is not possible to invest directly in an index.
The Russell 2000® Index measures the performance of the small-cap segment of the U.S. equity universe. The Russell 2000 Index is a subset of the Russell 3000® Index representing approximately 10% of the total market capitalization of that index. It includes approximately 2000 of the smallest securities based on a combination of their market cap and current index membership. The Russell 2000 is constructed to provide a comprehensive and unbiased small-cap barometer and is completely reconstituted annually to ensure larger stocks do not distort the performance and characteristics of the true small-cap opportunity set. The Index does not reflect investment management fees, brokerage commission and other expenses associated with investing in equity securities. It is not possible to invest directly in an index.
The iShares Core U.S. Aggregate Bond ETF seeks to track the investment results of the Bloomberg Barclays US Aggregate Bond Index. The Bloomberg Barclays US Aggregate Bond Index is a broad base, market capitalization-weighted bond market index representing intermediate term investment grade bonds traded in the United States.
The MSCI EAFE Index is broadly recognized as the pre-eminent benchmark for U.S. investors to measure international equity performance. It comprises the MSCI country indexes capturing large and mid-cap equities across developed markets in Europe, Australasia and the Far East, excluding the U.S. and Canada.
The MSCI Emerging Markets Index captures large and mid-cap representation across 26 emerging market countries. The index free float-adjusted market capitalization index and represents 13% of global market capitalization.
The S&P GSCI is a widely recognized benchmark that is broad-based, and production weighted to represent the global commodity market beta. The index includes the most liquid commodity futures.
The ibex USD Benchmark index spans an array of fixed income sectors including corporate, treasuries, sovereign, sub-sovereign, supranational, and covered, with a history dating back to December 1998.
Brent Crude Oil is a trading classification of sweet light crude oil that serves as a major benchmark price for purchases of oil worldwide. Brent is the leading global price benchmark for Atlantic basin crude oils. It is used to price approximately two thirds of the world’s internationally traded crude oil supplies.
The federal funds rate is the interest rate at which depository institutions lend reserve balances to other depository institutions overnight. The Federal Open Market Committee, which is the primary monetary policymaking body of the Federal Reserve, sets its desired target range.
A basis point is equal to one hundredth of one percent. It is used chiefly in expressing differences in interest rates.
The yield curve plots the interest rates of similar-quality bonds against their maturities. The most common yield curve plots the yields of U.S. Treasury securities for various maturities. An inverted yield curve occurs when short-term rates are higher than long-term rates.
The BBB rating is a credit rating used by S&P and Fitch credit rating agencies for long term bonds and some other investments. It is equivalent to the Baa2 rating used by Moody’s. A BBB rating represents a relatively low risk bond or investment. However, it is toward the bottom of investment grade bond ratings, being only two grades above junk bond ratings.
The price-to-earnings ratio is a valuation ratio which compares a company's current share price with its earnings per share (EPS). EPS is usually from the last four quarters (trailing P/E), but sometimes it can be derived from the estimates of earnings expected in the next four quarters (projected or forward P/E). The ratio is also sometimes known as "price multiple" or "earnings multiple."
Stocks of small-capitalization companies involve substantial risk. These stocks historically have experienced greater price volatility than stocks of larger companies, and they may be expected to do so in the future.
Stocks of mid-capitalization companies may be slightly less volatile than those of small-capitalization companies but still involve substantial risk and they may be subject to more abrupt or erratic movements than large capitalization companies.
International investing involves risks not typically associated with domestic investing, including risks of adverse currency fluctuations, potential political and economic instability, different accounting standards, limited liquidity and volatile prices.
Fixed income securities are subject to various risks, including changes in interest rates, credit quality, market valuations, liquidity, prepayments, early redemption, corporate events, tax ramifications and other factors. Debt securities typically decrease in value when interest rates rise. The risk is usually greater for longer-term debt securities. Investments in lower-rated and nonrated securities present a greater risk of loss to principal and interest than higher-rated securities.
Sector investments tend to be more volatile than investments that diversify across companies in many sectors.