Market and Economic Outlook - Released 6/30/19
Key takeaways
- Our enthusiasm for global equities has tempered a bit, amid slowing growth and increased uncertainty. After several years of favoring equities over bonds, we now have a more neutral outlook between the two asset classes.
- As the economic expansion in the U.S. enters its record-setting 11th year, we see signs of the economy in the late cycle phase. However, we do not see imminent signs of a recession.
- Falling interest rates have boosted the U.S. bond market this year, driven by lower inflation expectations and declining rates overseas. We expect returns from bonds going forward to be relatively low, but we believe that high quality bonds can provide diversification benefits for most investors during periods of stock market volatility.
The ports of Vietnam have been unusually busy this year. Exports to the United States have soared from there as companies shift their supply chains in response to increased tariffs on Chinese goods. Some cargo ships from China are even making stops there to “tweak” products before sending them on to the U.S., thereby circumventing the tariffs on Chinese imports. “Made in China” gets tariffed while “Made in Vietnam” does not—at least, not yet.
While Vietnam and other emerging economies have picked up much of the slack, tariffs have likely been a drag on global economic growth, including in the United States. But we do not expect the effects of tariffs to derail the U.S. economic expansion, which officially became the longest in U.S. history this summer.
However, our enthusiasm for global equities has tempered a bit, amid slowing corporate profit growth and increased uncertainty. After several years of favoring equities over bonds, we now have a more neutral outlook between the two asset classes.
Shifting to neutral
While the U.S. stock market is trading near all-time highs, we do see potential headwinds on the horizon. Economic growth appears to be slowing, both in the U.S. and abroad. This has impacted corporate profits, which are expected to plateau this year for companies in the S&P 500® index in aggregate.
We also believe that uncertainty around geopolitics and trade could lead to more market volatility if a clear resolution is not reached. Following an escalation in tariffs between the U.S. and China in May, the S&P 500® index fell over 6% before recovering in June. The rebound was primarily driven by two factors: 1) hope for interest rate cuts by the Federal Reserve, and 2) hope for a potential trade deal between the U.S. and China. If one or both fail(s) to materialize, then we would expect market volatility to resume.
We also continue to see signs that the U.S. is relatively late in the economic cycle. We agree with the adage that expansions do not die of old age, but there are other signs besides the calendar that we believe point to an economy later in its cycle. One example is the inverted yield curve, in which long-term U.S. Treasury yields are lower than short-term yields. (Figure 1) Although the timing is imprecise, an inverted yield curve has often preceded recessions. It should be noted, however, that rates fluctuate for many reasons and thus an inversion of the yield curve may be indicative of other economic factors.
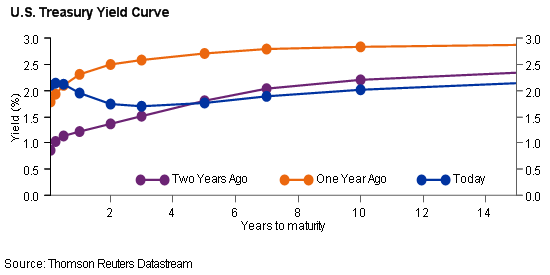 Figure 1
Additionally, the recent flattening out of corporate profits and declining margins is another classic late cycle indicator. And while Americans are enjoying the strongest labor market in years, a sub-4% unemployment rate is pretty rare territory that often doesn’t last long before retreating higher. (Figure 2)
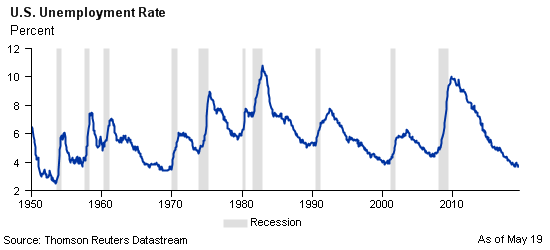 Figure 2
Although we see signs of the U.S. in the late cycle phase, we do not see imminent signs of a recession. We believe that there is still plenty of runway for growth, as cumulative growth during the expansion has been well below that of other expansions. And with the Federal Reserve (the Fed) possibly cutting interest rates later this year, we think that equities could still run higher. So, while we are less bullish on the stock market than we have been in the past, we do not believe it is time to batten down the hatches.
We have also taken a neutral outlook between U.S. and international equities. We continue to like international equities for their diversification benefits and long-term return potential, particularly in the emerging markets. But the near-term picture looks less favorable due to slowing economic growth overseas. (Figure 3)
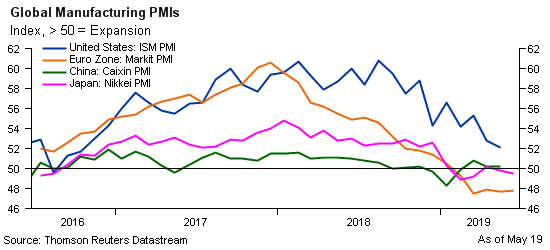 Figure 3
Fed changes its tune
Following two years of steady hikes in the federal funds rate, the Federal Reserve has changed its tune in 2019. Amid slowing, albeit moderate, economic growth and inflation continuing to run below its 2% target, the Fed has held its key interest rate steady this year and signaled that it could cut it if the economy slows or inflation remains low. Back in December, most participants in the Federal Open Market Committee (FOMC) were forecasting at least two rate hikes in 2019. As of June, nearly half of FOMC participants were forecasting two rate cuts this year.
Meanwhile, long-term rates have fallen sharply. After reaching a multiyear high of 3.25% back in October, the yield on a 10-year U.S. Treasury note dipped below 2% for the first time since the presidential election of 2016. Is this a signal from the bond market that a recession is coming? Not necessarily.
Credit spreads—the difference in yield between bonds of the same maturity but different credit ratings—still remain tight compared to historical averages. In other words, investors don’t appear to be fleeing to the safety of the highest quality bonds like you would expect in an uncertain economic environment. Inflation expectations, on the other hand, have fallen considerably this year, likely bringing interest rates down with them. (Figure 4) We expect low inflation to continue and view Treasury Inflation Protected Securities (TIPS) as less attractive in this environment. Additionally, declining interest rates overseas have probably weighed on rates here at home. (Figure 5)
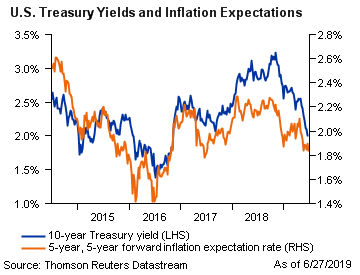 Figure 4
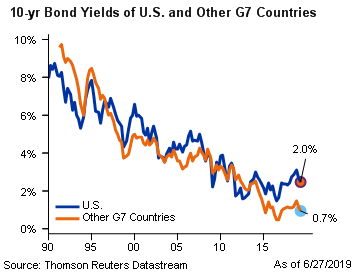 Figure 5
While falling interest rates have boosted the bond market this year, we expect returns from bonds going forward to be relatively low. Nonetheless, we continue to believe that high quality bonds can offer diversification benefits to most investors, particularly when stock market volatility increases.
The bottom line
Following years of favoring global stocks over bonds, we now have a more neutral outlook between the two asset classes. The U.S. stock market is back near all-time highs as we enter the record-setting 11th year of the economic expansion. But slowing economic growth, flat corporate profits, and potentially more market volatility have us less enthusiastic on equities than we have been in the past. However, with the Fed appearing to gear up for a rate cut, this expansion may have more room to run. Shippers in Vietnam certainly hope so.
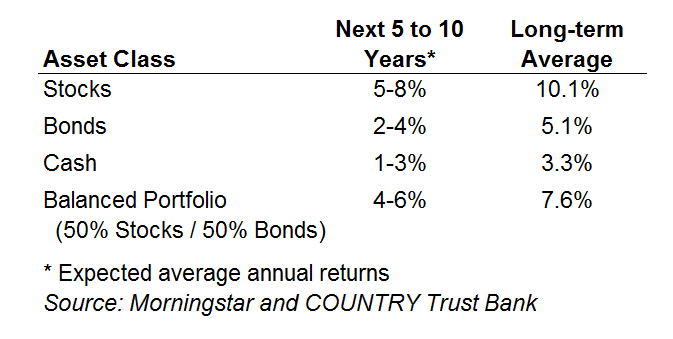 Figure 6
COUNTRY Trust Bank wealth management team
- Troy Frerichs, CFA - Director, Wealth Management & Financial Planning
- Kent Anderson, CFA - Portfolio Manager
- Todd Bunton, CFA - Portfolio Manager
- Weston Chenoweth - Investment Analyst
- Molly Ruddy - Investment Associate
- Chelsie Moore, CFA, CFP® - Manager, Wealth Management
- Jeff Hank, CFA, CFP® - Portfolio Manager
- Jonathan Strok, CFA - Investment Analyst
- Austin Burant - Investment Analyst
Looking for help navigating your future?
Set up a meeting with your local rep to review your current policies and make sure they're up to date. We pulled together some less obvious reasons to adjust your coverage.
COUNTRY Financial® is a family of affiliated companies (collectively, COUNTRY) located in Bloomington, IL. Learn more about who we are.
NOT FDIC-INSURED
May lose value
No bank guarantee
All information is as of the report date unless otherwise noted.
This material is provided for informational purposes only and should not be used or construed as investment advice or a recommendation of any security, sector, or investment strategy. All views expressed and forward-looking information, including forecasts and estimates, are based on the information available at the time of writing, do not provide a complete analysis of every material fact, and may change based on market or other conditions. Statements of fact are from sources considered reliable, but no representation or warranty is made as to their completeness or accuracy. Unless otherwise noted, the analysis and opinions provided are those of the COUNTRY Trust Bank investment team identified above and not necessarily those of COUNTRY Trust Bank or its affiliates.
Diversification, asset allocation and rebalancing do not assure a profit or guarantee against loss. All market indexes are unmanaged, and returns do not include fees and expenses associated with investing in securities. It is not possible to invest directly in an index.
Investment management, retirement, trust and planning services provided by COUNTRY Trust Bank®.
Past performance does not guarantee future results. All investing involves risk, including risk of loss.
Definitions and Important Information
The S&P 500® Index is an unmanaged index consisting of 500 large-cap U.S. stocks. Since it includes a significant portion of the total value of the market, it also considered representative of the market. The index does not reflect investment management fees, brokerage commission and other expenses associated with investing in equity securities. It is not possible to invest directly in an index.
The federal funds rate is the interest rate at which depository institutions lend reserve balances to other depository institutions overnight. The Federal Open Market Committee, which is the primary monetary policymaking body of the Federal Reserve, sets its desired target range.
The yield curve plots the interest rates of similar-quality bonds against their maturities. The most common yield curve plots the yields of U.S. Treasury securities for various maturities. An inverted yield curve occurs when short-term rates are higher than long-term rates.
Treasury Inflation Protected Securities (TIPS) are U.S. government securities whose principal value adjusts based on inflation rates, as measured by the Consumer Price Index.
Figures 1 - 5: Chart data comes from Thomson Reuters Datastream, a powerful platform that integrates top-down macroeconomic research and bottom-up fundamental analysis.
The long-term average return data in Figure 6 comes from Morningstar. The long-term annual return for each asset class is the compound average annual return for the period from 1926 through May 31, 2019. Stocks are represented by the Ibbotson® Large Company Stock Index, which is comprised of the S&P 500® Composite Index from 1957 to present, and the S&P 90® Index from 1926 to 1956. Bonds are represented by the Ibbotson® U.S. Intermediate-Term Government Bond Index. Cash is represented by the 30-day U.S. Treasury bill. COUNTRY Trust Bank’s forecasted stock returns include small capitalization and international equities. COUNTRY Trust Bank’s forecasted bond returns include investment grade corporate bonds. The “Balanced Portfolio” is representative of an investment of 50% stocks and 50% bonds rebalanced annually from 1926 through May 31, 2019. These returns are for illustrative purposes and not indicative of actual portfolio performance. It is not possible to invest directly in an index.
Stocks of small-capitalization companies involve substantial risk. These stocks historically have experienced greater price volatility than stocks of larger companies, and they may be expected to do so in the future.
Stocks of mid-capitalization companies may be slightly less volatile than those of small-capitalization companies but still involve substantial risk and they may be subject to more abrupt or erratic movements than large capitalization companies.
International investing involves risks not typically associated with domestic investing, including risks of adverse currency fluctuations, potential political and economic instability, different accounting standards, limited liquidity and volatile prices.
Fixed income securities are subject to various risks, including changes in interest rates, credit quality, market valuations, liquidity, prepayments, early redemption, corporate events, tax ramifications and other factors. Debt securities typically decrease in value when interest rates rise. The risk is usually greater for longer-term debt securities. Investments in lower-rated and nonrated securities present a greater risk of loss to principal and interest than higher-rated securities.
Sector investments tend to be more volatile than investments that diversify across companies in many sectors.