Market and Economic Outlook - Released 3/31/19
Key takeaways
- The pendulum of fear and greed has swung far in both directions the last few months. We expect the rapid pace of rising stock prices to slow and for volatility to resume.
- We are seeing some classic signs of the U.S. economy in the later stages of its cycle, although we feel recession risks remain low.
- We continue to slightly favor equities versus bonds near term, given continued U.S. economic growth, an accommodative Federal Reserve, and reasonable valuations within the context of low interest rates.
A study of penalty kicks in soccer found that a goalie’s odds of blocking a shot increase significantly by simply remaining in the center of the goal rather than jumping to the left or right in hopes of correctly guessing which way the ball will go1. Nonetheless, as the kick is coming, the vast majority of goalies dive to one side or the other. This is likely due to what psychologists call an “action bias”, or an impulse to do something to gain a sense of control, even if it’s counterproductive. Whether in sports or investing, standing still does not feel natural, but sometimes it’s the best move.
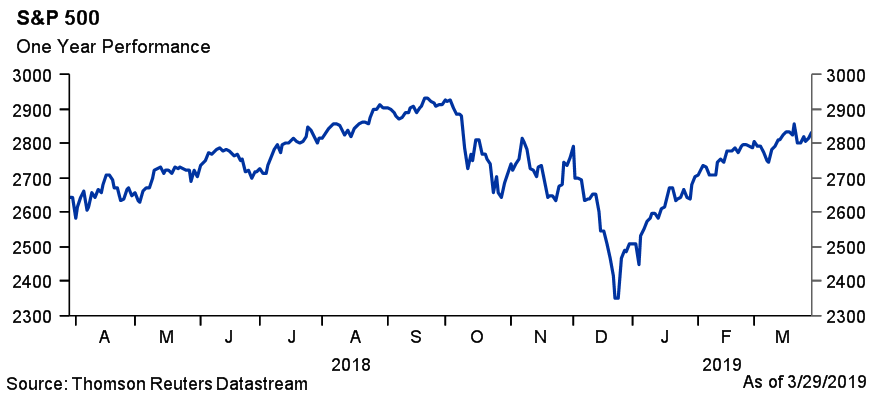
Most equity investors who stood still during the market correction late last year were rewarded with a sharp rebound in stocks in the first quarter. Following its worst December performance since 1931, the S&P 500® index posted its best first quarter in over 20 years. It is now within arm’s reach of an all-time high. (Figure 1)
The pendulum of fear and greed has swung far in both directions the last few months. We expect the rapid pace of rising stock prices to slow and for volatility to resume. However, we continue to slightly favor equities versus bonds near term, given continued growth, an accommodative Federal Reserve, and reasonable valuations within the context of low interest rates.
 Figure 1
Fed hits pause amid slowing growth
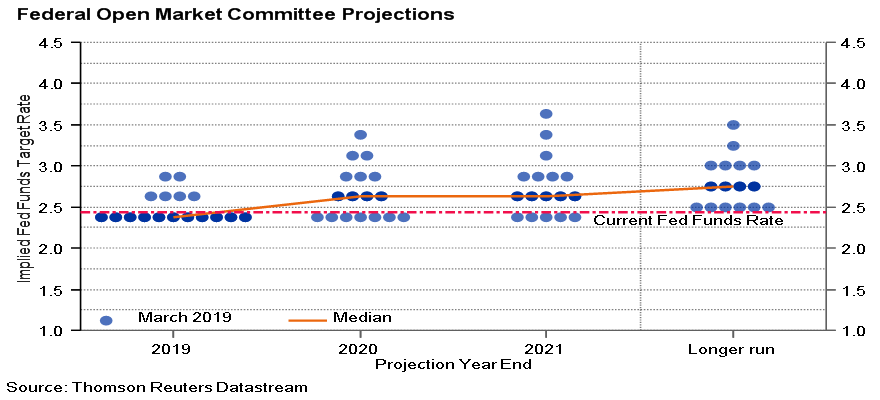
One of the big drivers of the large swings in the U.S. stock market has been the Federal Reserve (Fed). The central bank is tasked with setting short-term interest rates in an effort to achieve maximum employment and stable prices. Late last year, amid strong growth, the Fed appeared to be on a set path of continued interest rate increases, which stirred up fears of a potential economic slowdown. The Fed has changed its tune this year. Based on their own recent projections, additional rate hikes appear unlikely in 2019. (Figure 2) The stock market has applauded this news.
 Figure 2
While a rate pause may be supportive for equity prices, slowing economic growth could become a headwind. Following solid GDP growth of 2.9% in 2018, the U.S. economy looks poised to slow this year. We are seeing some classic signs of an economy in the later stages of its cycle, notably a tight labor market, a flat yield curve, and pressure on corporate profit margins. We believe the odds of a recession remain low in the near term, but we are watching the data closely.
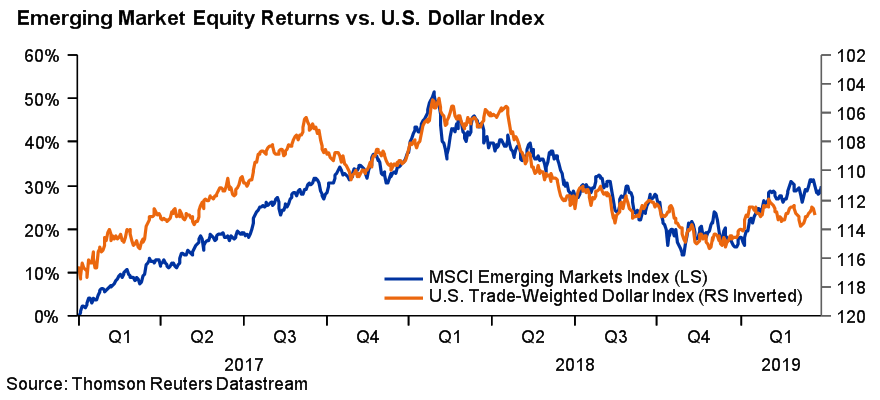
Nevertheless, economic growth in the United States remains a bright spot in the developed world, as growth has slowed considerably throughout Europe and Japan. As a result, we have trimmed our allocation to developed international equity markets. We continue to favor emerging markets, amid attractive valuations and a weakening U.S. dollar. (Figure 3)
U.S. corporate profits are still expected to grow in 2019, albeit well below the blistering 20% rate experienced in 2018, which was fueled in part by tax cuts. According to Thomson Reuters, earnings per share for companies in the S&P 500 index are projected to rise about 7% this year, although those estimates have been steadily falling for months. The S&P 500 currently trades around 17 times 2019 consensus estimates, which is a bit above its long-term average but not unreasonable given the low interest rate environment.
 Figure 3
Flat yield curve
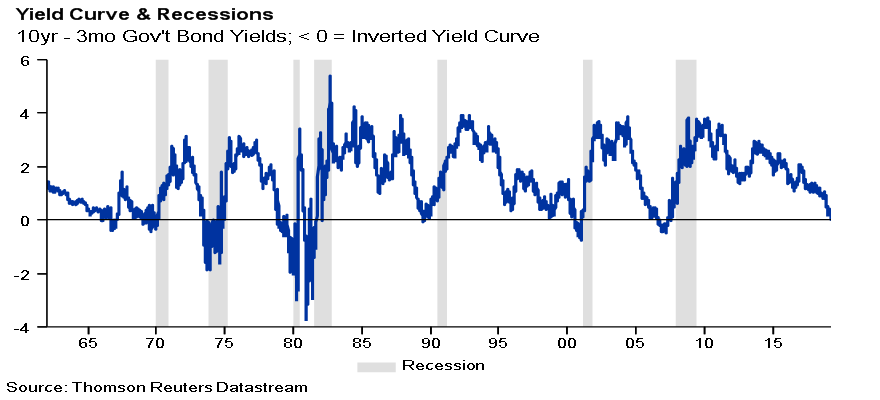
Although the Fed raised short-term interest rates throughout much of the last two years, long-term interest rates have not risen in tandem. The result has been a flat yield curve. The 10-year U.S. Treasury note yielded just 2.41% at the end of March, or 2 basis points (0.02%) less than a 1-month Treasury bill. In other words, fixed income investors were earning slightly more interest on shorter-term government debt than some longer-term government debt. This is a fairly rare phenomenon that often foreshadows economic downturns, although the timing is imprecise. (Figure 4)
 Figure 4
Given the flat yield curve, we do not believe that most bond investors are being adequately compensated for duration risk, as longer duration debt securities typically have higher price sensitivity to interest rate changes than shorter duration securities. As a result, we continue to favor short-term bonds. We also continue to favor high quality bonds, which can provide stability to portfolios during periods of stock market volatility. This was the case in the fourth quarter of 2018, as prices for high quality bonds increased while stock prices were plunging. Although yields for investment grade bonds remain low by historical standards, their diversification benefits can still provide a lot of value for certain portfolios.
The bottom line
The U.S. stock market has experienced some dramatic swings over the last few months. While an accommodative Fed, positive – albeit slower – growth, and reasonable valuations have helped drive big gains so far in 2019, we expect to see an uptick in volatility.
However, trying to make dramatic moves in anticipation of which way the market will go is likely a bad strategy. As Warren Buffett says, “activity is the enemy of investment returns”. It’s also the enemy of blocking penalty kicks.
Happy anniversary bull market
On March 6, 2009, the S&P 500 hit an intraday low of 667. It had plummeted a staggering 58% from its high on October 11, 2007, and the outlook for the U.S. economy and financial markets looked bleak. Formerly stable companies were failing or teetering on the brink of collapse, and pundits and prognosticators were calling for more doom and gloom.
But the stock market took off from there and hasn’t looked back since. Over the ensuing 10 years, the S&P 500 delivered spectacular average annual returns of 17.6%.
The best returns from the stock market often follow periods of fear and uncertainty from investors. Considering the prolonged strength of the economy and general optimism by investors, we do not expect the next 10 years to be as good as the last 10.
COUNTRY Trust Bank wealth management team
- Troy Frerichs, CFA - Director, Wealth Management & Financial Planning
- Kent Anderson, CFA - Portfolio Manager
- Todd Bunton, CFA - Portfolio Manager
- Weston Chenoweth - Investment Analyst
- Chelsie Moore, CFA, CFP® - Manager, Wealth Management
- Jeff Hank, CFA, CFP® - Portfolio Manager
- Jonathan Strok, CFA - Investment Analyst
- Austin Burant - Investment Analyst
Endnote
1. Action Bias Among Elite Soccer Goalkeepers: The Case of Penalty Kicks. Journal of Economic Psychology, Volume 28, No. 5, 2007.
Looking for help navigating your future?
Set up a meeting with your local rep to review your current policies and make sure they're up to date. We pulled together some less obvious reasons to adjust your coverage.
COUNTRY Financial® is a family of affiliated companies (collectively, COUNTRY) located in Bloomington, IL. Learn more about who we are.
NOT FDIC-INSURED
May lose value
No bank guarantee
All information is as of the report date unless otherwise noted.
This material is provided for informational purposes only and should not be used or construed as investment advice or a recommendation of any security, sector, or investment strategy. All views expressed and forward-looking information, including forecasts and estimates, are based on the information available at the time of writing, do not provide a complete analysis of every material fact, and may change based on market or other conditions. Statements of fact are from sources considered reliable, but no representation or warranty is made as to their completeness or accuracy. Unless otherwise noted, the analysis and opinions provided are those of the COUNTRY Trust Bank investment team identified above and not necessarily those of COUNTRY Trust Bank or its affiliates.
Diversification, asset allocation and rebalancing do not assure a profit or guarantee against loss. All market indexes are unmanaged, and returns do not include fees and expenses associated with investing in securities. It is not possible to invest directly in an index.
Investment management, retirement, trust and planning services provided by COUNTRY Trust Bank®.
Past performance does not guarantee future results. All investing involves risk, including risk of loss.
Definitions
The S&P 500® Index is an unmanaged index consisting of 500 large-cap U.S. stocks. Since it includes a significant portion of the total value of the market, it also considered representative of the market. The index does not reflect investment management fees, brokerage commission and other expenses associated with investing in equity securities. It is not possible to invest directly in an index.
The federal funds rate is the interest rate at which depository institutions lend reserve balances to other depository institutions overnight. The Federal Open Market Committee, which is the primary monetary policymaking body of the Federal Reserve, sets its desired target range.
The yield curve plots the interest rates of similar-quality bonds against their maturities. The most common yield curve plots the yields of U.S. Treasury securities for various maturities. An inverted yield curve occurs when short-term rates are higher than long-term rates.
The Trade Weighted US Dollar Index is a measure of the foreign exchange value of the U.S. dollar relative to major foreign currencies used widely in international trade. The weighting of each foreign currency in the index, which changes over time, is based on the value of tradable goods produced in the respective foreign economies. It is not possible to invest directly in an index.
The MSCI Emerging Markets Index captures large and mid-cap representation across 23 emerging market countries. The index covers approximately 85% of the free float-adjusted market capitalization in each country.
The price-to-earnings ratio is a valuation ratio which compares a company's current share price with its earnings per share (EPS). EPS is usually from the last four quarters (trailing P/E), but sometimes it can be derived from the estimates of earnings expected in the next four quarters (projected or forward P/E). The ratio is also sometimes known as "price multiple" or "earnings multiple."
Duration is a measure of a security’s interest rate risk. It is based on the timing of cash flows received by an investor and expressed in years. Longer duration securities typically have higher price sensitivity to interest rate changes than shorter duration securities.
Figures 1 – 4: Chart data comes from Thomson Reuters Datastream, a powerful platform that integrates top-down macroeconomic research and bottom-up fundamental analysis.
Stocks of small-capitalization companies involve substantial risk. These stocks historically have experienced greater price volatility than stocks of larger companies, and they may be expected to do so in the future.
Stocks of mid-capitalization companies may be slightly less volatile than those of small-capitalization companies but still involve substantial risk and they may be subject to more abrupt or erratic movements than large capitalization companies.
International investing involves risks not typically associated with domestic investing, including risks of adverse currency fluctuations, potential political and economic instability, different accounting standards, limited liquidity and volatile prices.
Fixed income securities are subject to various risks, including changes in interest rates, credit quality, market valuations, liquidity, prepayments, early redemption, corporate events, tax ramifications and other factors. Debt securities typically decrease in value when interest rates rise. The risk is usually greater for longer-term debt securities. Investments in lower-rated and nonrated securities present a greater risk of loss to principal and interest than higher-rated securities.
Sector investments tend to be more volatile than investments that diversify across companies in many sectors.