Market and Economic Outlook - Released 12/31/21
Key takeaways
- What was once accommodative central bank policy is likely to turn more hawkish as we move through 2022.
- U.S. corporate earnings were strong in 2021, and while we do not expect the same level of growth, earnings are likely to continue their upward trajectory providing the opportunity for stocks to continue to outpace bonds.
- Investment grade bonds have historically provided low correlated returns to stocks during times of market tumult. For this reason, bonds continue to play an important role in investors’ portfolios.
As we approach a new year, many investors attempt to make predictions for what’s in store for the next year. It can be a fun exercise, but oftentimes an impossible task, as forecasting financial markets over the short term is extremely difficult. Economist John Kenneth Galbraith once said, “There are two kinds of forecasters: those who don’t know, and those who don’t know they don’t know.” Last year at this time, very few forecasted the S&P 500 to return over 25%, and rising inflation hadn’t been widely discussed since the late 1970s.
Instead of making guesses on what lies ahead in 2022, our approach relies on developing a strategy which analyzes the current economic environment and relative valuation for various market segments. Critical to this analysis is identifying the current risk factors. Today, these are numerous. The persistency of inflationary pressures, how the Federal Reserve will address this risk, the ongoing threat of COVID 19 and its impacts on economic activity, the supply chain, and the job market to name a few.
Inflation: more persistent than originally thought
Inflation was the talk of the quarter and seems to be the largest risk to the economic outlook. For most of 2021, the Federal Reserve (the Fed) led by Jerome Powell held to the notion that inflation would be transitory. We were coming off a large drop in prices as things were just getting back to normal. However, as economic growth accelerated, inflation became more persistent than originally expected. In the latest reading, headline inflation rose 6.8% over the past year with gas prices, shelter and new and used vehicles all recording gains.
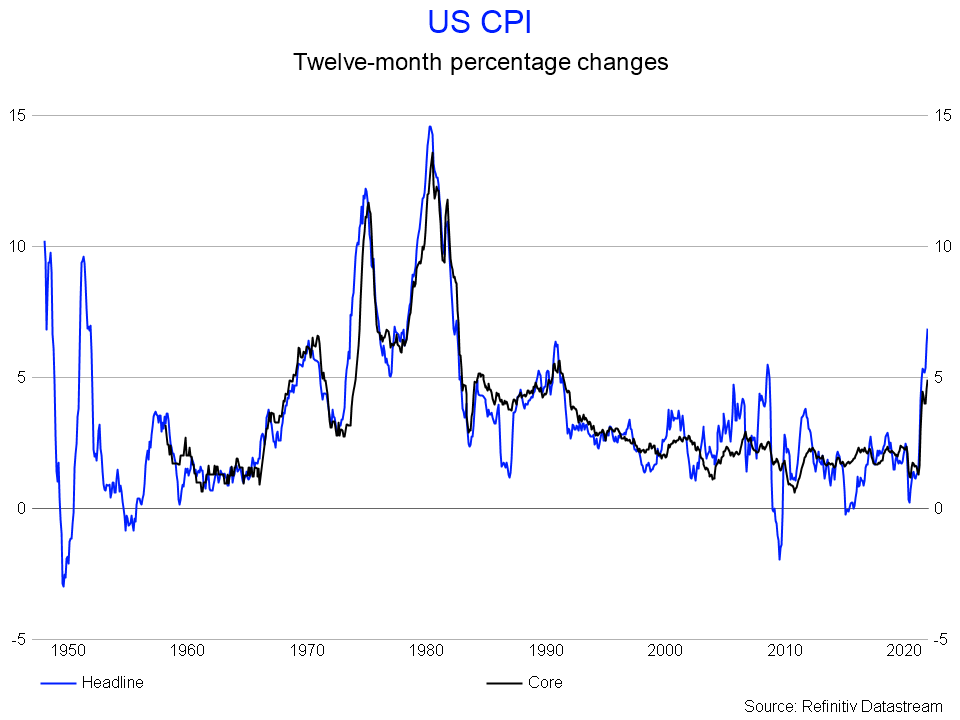 Figure 1
As a result, the Federal Open Market Committee announced they will wind down their purchases of U.S. Treasury and mortgage-backed securities faster than originally forecasted and project increases in the Federal Funds rates in 2022. A survey by COUNTRY Financial® (fielded by Ipsos) shows that Americans are feeling the inflation pressure as 9 out of 10 are concerned about inflation.
Navigating a tight labor market
The job market is very tight as employers are having to compete to find workers. Individuals have been reluctant to jump back into the labor force for various reasons which has left the participation rate lower than it was prior to the onset of the pandemic. With early retirements, we may not see the participation rate return to pre-pandemic levels for some time. The number of job openings at the end of October was 11 million which was an increase of 431,000 over the previous month. The amount of people quitting their jobs remains higher than usual as many are finding better and/or higher paying jobs than the one they left. Jobless claims have also come down considerably and hit the lowest level it has seen since the late 1960’s as employers hold on to the employees they already have. The unemployment rate now stands at 4.2%. The tight labor market is likely a reason why we saw average earnings increase 4.8% year-over-year in November.
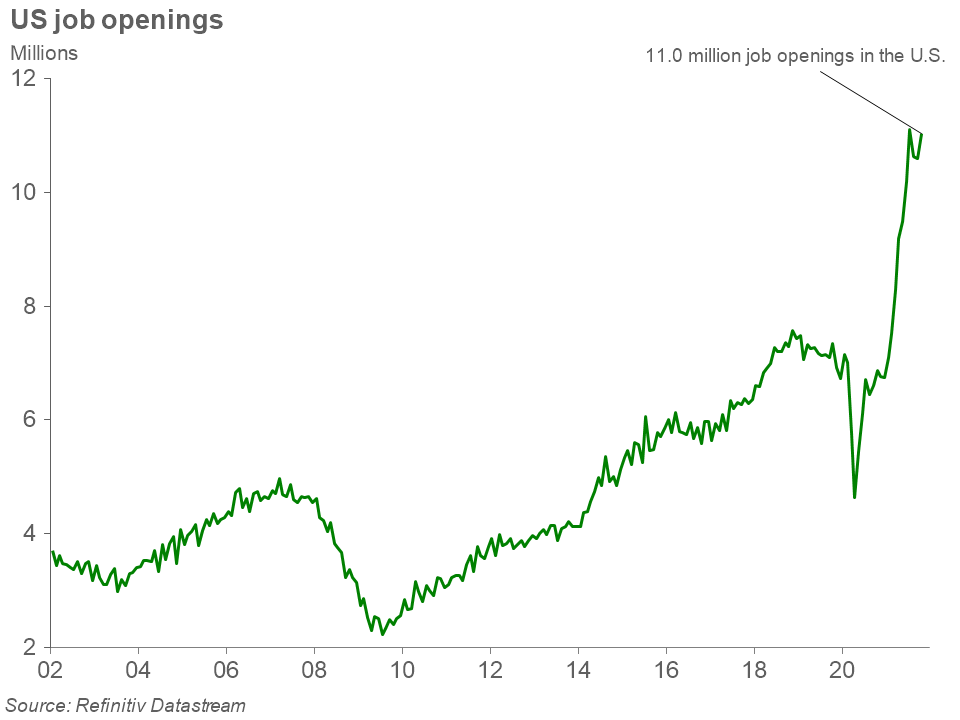 Figure 2
While companies are feeling the pressure of a tight labor market, rising wages, inflation, and a supply chain that continues to be hamstrung by bottlenecks at ports, there are some positives heading into next year. Demand for goods continues to be strong and is part of the reason for inflation pressures we have experienced. Retail sales heading into the holiday season were strong. November’s retail sales were up 18% from November of 2020. While supply chains continue to have their troubles, we have seen some signs of the ship beginning to steer in the right direction. Supplier deliveries continue to slow, but at a slower pace than before. Looking into 2022, growth is expected to continue around the world.
Strong global returns in ‘21 – continued growth in ‘22
The Organization for Economic Cooperation and Development expects that U.S. GDP will advance 3.7% in 2022 while the Euro area and the UK will advance 4.3% and 4.7%, respectively. Looking at the U.S., the new $1.2 trillion Infrastructure Investment and Jobs Act will provide some additional stimulus to an already strong economy. This will provide funding for roads and bridges, broadband internet, water infrastructure and other areas needing new investment, replacement, or repair. There is another bill waiting in the wings, the Build Back Better act, which could provide another $1.75 trillion in spending on childcare and early education, child tax credits, and affordable health care among others. While Senator Joe Manchin has stated that he will be a no-vote for the bill, it is likely that we will either see this bill continue to undergo amendments or some of the items will show up in different legislation.
U.S. stock markets continued their strong run in the fourth quarter. The S&P 500 was up 11% in the fourth quarter and returned 28.7% for the year. Energy has been the top performer this year as oil prices jumped from about $47 to start the year and above $75 to finish. Real estate also bounced back after having a tough year in 2020 to return 46% in 2021. All sectors were up for the year double-digits. Small cap stocks were up 1.7% in the quarter and returned 14.8% for the year.
With continued economic growth, we expect company earnings to continue their expansion in the new year. We feel this growth will be needed for stocks to continue to drive higher as valuations remain elevated with such strong performance the last 3 years. Some of the largest stocks in the U.S. such as Amazon, Alphabet and Microsoft continued their outperformance in 2021. Valuations for the largest stocks are not as attractive as other areas of the U.S. market, and for this reason we favor smaller company stocks.
International developed stocks returned 11.3% this year. Emerging markets were down 2.5%. With the continued divergence between U.S. and international returns, international stocks now look very cheap. We continue to see opportunity in international developed stocks which are a good value relative to the U.S. We are less positive on emerging markets due to China’s increasing weight in the asset class and the issues we have seen there.
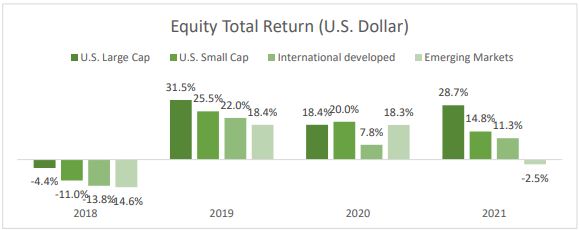 Figure 3
Rising rates in 2022
Investment grade bonds, as measured by the Bloomberg Aggregate Bond Index, returned -1.5% during 2021 due to interest rates increasing from record lows. The interest earned on the bonds was not enough to offset the decline in market prices. This was only the second time this index produced a negative return over the last 20 years.
The Treasury yield curve flattened during 2021 as short rates rose faster than long rates. Investors in longer term bonds were anticipating interest rate increases will eventually slow economic growth over the long term. We don’t expect this mindset to change and expect bond yields to remain low.
The evolving inflation outlook and the Fed’s potential reaction is a key risk factor hanging over the bond market. Elevated inflation readings have resulted in negative real yields for most investment grade bonds today. As a result, the Fed has pivoted towards a more hawkish monetary policy. It remains to be seen how aggressive the Fed will be in raising short term interest rates. The Fed’s dot plot chart records projections from the 12 members of the Federal Open Market Committee. It shows members of the Fed expect 3 rate increases of 0.25% next year. In our view, the Fed has limited room to move rates higher if it wants to avoid a flat or inverted yield curve.
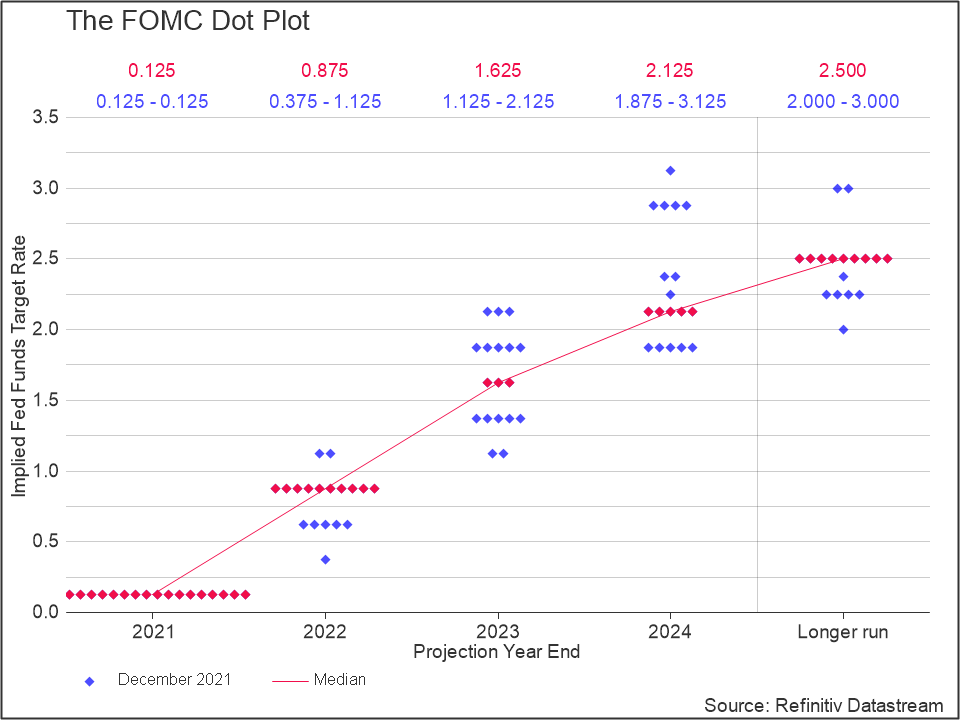 Figure 4
Despite the move higher in U.S. Treasury yields and an uncertain inflation picture, credit spreads (which is the difference in yield between a corporate bond and a similar maturity Treasury) have not moved meaningfully higher. Most company balance sheets are in excellent shape and they have sufficient cash flow to service their debt at today’s low interest rates. Demand for yield remains high from institutional investors both here and abroad and is likely a reason why credit spreads haven’t widened significantly.
An area of fixed income that looks attractive in this environment are floating rate bank loans. These types of securities are typically issued by highly leveraged companies. They offer relatively high interest payments which are set at a spread above a common short-term interest rate which resets periodically. This floating rate feature historically has benefited this asset class during inflationary environments but can be volatile in an economic downturn. Floating rate bank loans can complement, but not replace, high-quality, investment-grade bonds. Investment-grade bonds continue to provide stability within multi-asset portfolio returns. This was proven again when discovery of the Omicron variant led to stocks selling off in late November.
The bottom line
Forecasting the twists and turns of financial markets over the short-term is difficult and should not take precedence over developing a long-term plan with a trusted financial professional. After all, legendary investor Peter Lynch wisely said: "Far more money has been lost by investors trying to anticipate corrections, than lost in the corrections themselves." No matter what events will impact financial markets during 2022, focus on the long-term remains our preferred path.
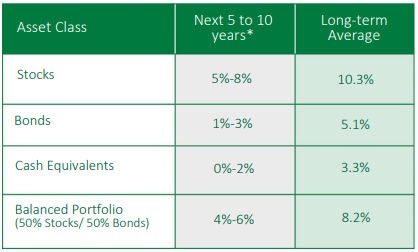 Figure 5
* Forecasted average annual returns of COUNTRY Trust Bank Wealth Management
Source: Morningstar and COUNTRY Trust Bank – See definitions and important information below
COUNTRY Trust Bank wealth management team
- Troy Frerichs, CFA - VP, Investment Services
- Jeff Hank, CFA, CFP® - Manager, Wealth Management
- G. Ryan Hypke, CFA, CFP® - Portfolio Manager
- Weston Chenoweth - Investment Analyst
- Molly Ruddy - Investment Analyst
- Chelsie Moore, CFA, CFP® - Director, Wealth Management & Financial Planning
- Kent Anderson, CFA - Portfolio Manager
- Jonathan Strok, CFA - Portfolio Manager
- Jamie Czesak - Investment Analyst
Looking for help navigating your future?
Set up a meeting with your local rep to review your current policies and make sure they're up to date. We pulled together some less obvious reasons to adjust your coverage.
COUNTRY Financial® is a family of affiliated companies (collectively, COUNTRY) located in Bloomington, IL. Learn more about who we are.
NOT FDIC-INSURED
May lose value
No bank guarantee
All information is as of the report date unless otherwise noted.
This material is provided for informational purposes only and should not be used or construed as investment advice or a recommendation of any security, sector, or investment strategy. All views expressed and forward-looking information, including forecasts and estimates, are based on the information available at the time of writing, do not provide a complete analysis of every material fact, and may change based on market or other conditions. Statements of fact are from sources considered reliable, but no representation or warranty is made as to their completeness or accuracy. Unless otherwise noted, the analysis and opinions provided are those of the COUNTRY Trust Bank investment team identified above and not necessarily those of COUNTRY Trust Bank or its affiliates.
Diversification, asset allocation and rebalancing do not assure a profit or guarantee against loss. All market indexes are unmanaged, and returns do not include fees and expenses associated with investing in securities. It is not possible to invest directly in an index.
Investment management, retirement, trust and planning services provided by COUNTRY Trust Bank®.
Past performance does not guarantee future results. All investing involves risk, including risk of loss.
Definitions and Important Information
Figures 1,2,3,4: Chart data comes from Refinitiv (formerly Thomson Reuters) DataStream, a powerful platform that integrates top-down macroeconomic research and bottom-up fundamental analysis.
Figure 5: The long-term average return data comes from Morningstar and is based upon compound average annual returns for the period from 1926 through December 31, 2020 Stocks are represented by the Ibbotson® Large Company Stock Index, which is comprised of the S&P 500® Composite Index from 1957 to present, and the S&P 90® Index from 1926 to 1956. Bonds are represented by the Ibbotson® U.S. Intermediate-Term Government Bond Index. Cash Equivalents are represented by the 30-day U.S. Treasury bill. The “Balanced Portfolio” is representative of an investment of 50% stocks and 50% bonds rebalanced annually. Forecasted stock returns include small capitalization and international equities. Forecasted bond returns include investment grade corporate bonds. These returns are for illustrative purposes and not indicative of actual portfolio performance. It is not possible to invest directly in an index.
The S&P 500® Index is an unmanaged index consisting of 500 large-cap U.S. stocks. Since it includes a significant portion of the total value of the market, it also considered representative of the market. The index does not reflect investment management fees, brokerage commission and other expenses associated with investing in equity securities. It is not possible to invest directly in an index.
GDP or Gross Domestic Product is the monetary value of all goods and services produced during a specified period. The figure is used as a barometer of an economy’s health including its size and growth rate. In the U.S., quarterly GDP figures are typically “annualized” meaning the quarterly growth is compounded for four quarters.
The federal funds rate is the interest rate at which depository institutions lend reserve balances to other depository institutions overnight. The Federal Open Market Committee, which is the primary monetary policymaking body of the Federal Reserve, sets its desired target range.
The real rate of return is the return on an investment after adjusting for inflation. It is calculated by taking the gross return after subtracting the inflation rate.
A basis point is equal to one hundredth of one percent. It is used chiefly in expressing differences in interest rates.
The yield curve plots the interest rates of similar-quality bonds against their maturities. The most common yield curve plots the yields of U.S. Treasury securities for various maturities. An inverted yield curve occurs when short-term rates are higher than long-term rates.
The Morgan Stanley Capital International All Country World Index Ex-U.S. (MSCI ACWI Ex-U.S.) is a market-capitalization-weighted index maintained by Morgan Stanley Capital International (MSCI). It is designed to provide a broad measure of stock performance throughout the world, except for U.S.-based companies. The MSCI ACWI Ex-U.S. includes both developed and emerging markets.
The price-to-earnings ratio is a valuation ratio which compares a company's current share price with its earnings per share (EPS). EPS is usually from the last four quarters (trailing P/E), but sometimes it can be derived from the estimates of earnings expected in the next four quarters (projected or forward P/E). The ratio is also sometimes known as "price multiple" or "earnings multiple."
Stocks of small-capitalization companies involve substantial risk. These stocks historically have experienced greater price volatility than stocks of larger companies, and they may be expected to do so in the future.
The Consumer Price Index (CPI) measures the average change in prices over time that consumers pay for a basket of goods and services. Core CPI is the CPI subtracting energy and food prices.
International investing involves risks not typically associated with domestic investing, including risks of adverse currency fluctuations, potential political and economic instability, different accounting standards, limited liquidity and volatile prices.
The BBB rating is a credit rating used by S&P and Fitch credit rating agencies for long term bonds and some other investments. It is equivalent to the Baa2 rating used by Moody’s. A BBB rating represents a relatively low risk bond or investment. However, it is toward the bottom of investment grade bond ratings, being only two grades above junk bond ratings.
The Personal Consumption Expenditures Price index is a nation-wide indicator of the average increase in prices for all domestic personal consumption. It's indexed to a base of 100 in 1992. It's derived from the largest Gross Domestic Product component, personal consumption expenditures.
Fixed income securities are subject to various risks, including changes in interest rates, credit quality, market valuations, liquidity, prepayments, early redemption, corporate events, tax ramifications and other factors. Debt securities typically decrease in value when interest rates rise. The risk is usually greater for longer-term debt securities. Investments in lower-rated and nonrated securities present a greater risk of loss to principal and interest than higher- rated securities.
The labor force participation rate is the percentage of the population that is working or actively looking for work.