Market and Economic Outlook - Released 1/6/21
Key takeaways
- COVID vaccines have given investors more clarity going into 2021 and gave markets the boost they needed in the fourth quarter. Investors are now looking through to the future state of the economy.
- Many policy actions are still likely to need bipartisan support given the makeup of the Senate and rules currently in place.
- Companies fared much better than expected in the second half of the year, and while valuations look stretched, we believe stocks are positioned to outperform bonds in 2021.
The result of an investment decision can be very uncertain the moment a trade is placed. Of course, after time has passed, it becomes very clear whether the decision was beneficial. In the world of investing, hindsight truly is 2020. As we look back at the year, it’s hard to believe what occurred given the circumstances. The devastation caused by the COVID-19 pandemic is well known and continues to impact how we work and live. However, instead of focusing on the challenges we face today, investors are looking through to the hope of a better future. Despite the worst economic contraction since the Great Depression, coupled with a tumultuous election season, financial markets ended the year near record highs.
Looking to the future
The fourth quarter saw broad based rallies across the globe. Not only did the S&P 500 set 10 new closing highs, the Russell 2000 small-cap index and MSCI Emerging Markets index set new closing highs, and the MSCI EAFE index is 0.7% from a new all-time high. While the economy is going through a second phase of shutdowns in certain areas, the markets have largely looked past this, and all eyes have turned to the effectiveness of COVID-19 vaccines as a path to economic stability. November gave markets the visibility they were seeking in the form of a definitive election result, a likely divided government and very positive vaccine news with both Pfizer/BioNTech and Moderna announcing their vaccines were over 90% effective in phase 3 trials.
The Federal Reserve Bank of Atlanta’s GDPNow forecast expects fourth quarter real GDP growth of 10.4%. Much of this is anticipated to come in the form of increased consumer spending and inventory investment as firms have higher confidence moving into 2021 (Figure 1). Vaccine efficacy, timing, and vaccination rates are all critical factors in progressing forward. Any unexpected surprises to these components will likely cause volatility. As they have been all year, the Federal Reserve remains ready and willing to use monetary policy to step in when needed. They are likely to continue to with their asset purchase programs and are projecting the Fed Funds rate will remain unchanged at 0-0.25% over the next few years. While the good news seems to be priced in to current stock and bond prices, we believe an economic recovery in 2021 will benefit risk assets. For this reason, we are moving to a slight overweight to stocks vs. bonds in multi asset portfolios.
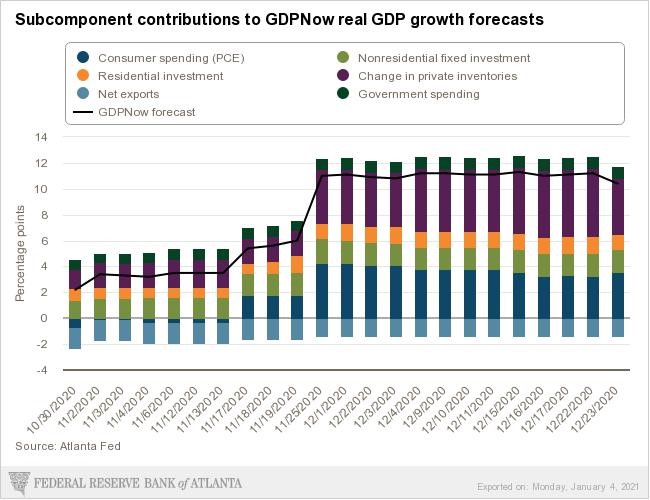 Figure 1
A new year, a new administration
President-elect Biden and Vice President-elect Harris will take the Oath of Office on January 20th. The Georgia Senate run-off is yet to be resolved as of this writing. Regardless of outcome, companies will continue to adjust to any changes in regulations and laws as they have in the past. We believe the passage of impactful pieces of legislation will require bipartisan support due to the makeup of the Senate and legislative rules currently in place.
While Congress remained divided in 2020, they did pass 4 major stimulus packages during 2020, providing aid to small business and direct payments to individuals. The final package was signed into law by President Trump on December 27th. Despite many shelter in place orders, government stimulus checks resulted in consumer spending hitting record highs. Many people paid off their credit cards and household balance sheets are now in great shape. Some workers have been able to easily transition to working from home while workers in the service industry have been harder hit. Although the next several months could be volatile, there is likely pent up demand for services and entertainment as the personal savings rate is still elevated (Figure 2). We expect spending on travel and entertainment to increase during the 2nd half of 2021.
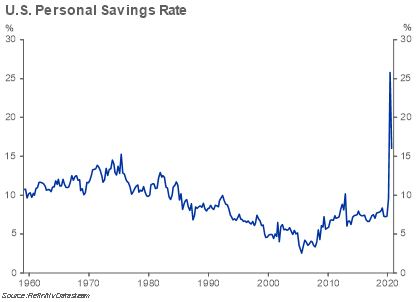 Figure 2
Better than expected
S&P 500 earnings have been better than feared as many businesses have been able to adapt to an online environment. However, given the significant move higher in stock prices since March, valuations are elevated. The forward price-to-earnings (P/E) ratio on the S&P 500 is near all-time highs. Earnings need to show strength next year to support the current market valuations. Select technology companies experienced powerful upward moves making us concerned some areas of the stock market are priced for perfection.
Broad market valuations are high, but cyclical sectors like energy, financials and industrials appear more attractively priced. We believe an economic recovery could lead to different areas of market strength. We continue to think U.S. small and mid-cap stocks provide a better opportunity than U.S. large caps.
The MSCI EAFE Index, a broad measure of non-U.S. developed market stocks, has trailed the performance of the S&P 500 for the last 10 years. We continue to believe non-U.S. stock valuations look attractive compared to U.S. large caps which bodes well for better relative performance going forward (Figure 3). Non-U.S. stocks tend to have a heavier weighting to cyclical sectors. A resurgence in these names, along with a weakening dollar, led to MSCI EAFE outperforming the S&P 500 during the 4th quarter.1
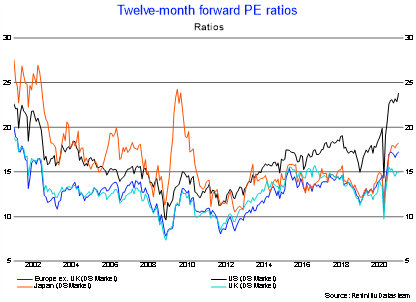 Figure 3
Lower for (much) longer
A decline in interest rates boosted returns for bond investors during the year. Short term Treasury rates remain anchored, as the Federal Reserve is signaling they will not raise the Federal Funds rate during 2021. However, longer-term Treasury rates did drift higher during the quarter, as investors priced in additional supply from fiscal stimulus. Overall, the Treasury yield curve has steepened since mid-year, signaling the economy is on solid ground (Figure 4).
 Figure 4
Outgoing Treasury Secretary Steven Mnuchin stated many of the Federal Reserve’s emergency lending actions, which provided unprecedented support for bond markets during 2020, will not be extended into the new year. However, the naming of former Fed Chairwoman Janet Yellen as his replacement was viewed favorably. She has worked closely with current Fed Chairman Jay Powell and many believe their views are aligned when it comes to supporting the economic recovery.
The Fed’s support was a key ingredient in riskier bonds outperforming during the 2nd half of the year. The difference in interest rates corporations pay over the U.S. Treasury rate has declined considerably from the elevated levels reached during the spring. This has led to strong returns on investment grade rated corporate bonds. Below investment grade bonds have also rebounded, producing stock like returns since the end of the first quarter. Lower borrowing costs allowed companies and municipalities to refinance existing debt during the year. Investment grade bond issuance hit record levels and the increased issuance was met with strong demand.
With low Treasury rates and tight credit spreads, we believe bond market returns over the next few years will be lower than historical averages. Though Fed support may wane during 2021, an economic recovery could benefit risk taking in bonds. We continue to see value in preferred stocks, floating-rate loans, and emerging market debt within fixed income markets. The yields on these types of investments are attractive relative to U.S. investment grade bonds. However, we feel it makes sense for most investors in multi asset portfolios to continue to rely on their bond allocation to provide stabilization against stock market risk.
The bottom line
This was a year of unprecedented circumstances and uncertainty for everyone. It seemed unlikely in March global stock markets would end the year at these levels, but those who stayed the course were rewarded. The decision to ride out the turmoil seems obvious looking back but was difficult to make at the time.
We are hopeful 2021 will see an end to the COVID-19 pandemic. It’s important to note, each year contains its own unique challenges. We believe at the core of any good investment decision is a sound financial plan. Having a plan, and sticking to it, no matter the uncertainty we face, continues to be a proven strategy. This approach is critical to overcoming the volatility each year brings and should remain a priority for investors during 2021.
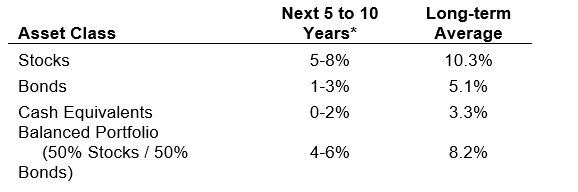 Figure 5
* Forecasted average annual returns of COUNTRY Trust Bank Wealth Management
Source: Morningstar and COUNTRY Trust Bank – See important information below
COUNTRY Trust Bank wealth management team
- Troy Frerichs, CFA - VP, Investment Services
- Jeff Hank, CFA, CFP® - Manager, Wealth Management
- G. Ryan Hypke, CFA, CFP® - Portfolio Manager
- Weston Chenoweth - Investment Analyst
- Molly Ruddy - Investment Analyst
- Chelsie Moore, CFA, CFP® - Director, Wealth Management & Financial Planning
- Kent Anderson, CFA - Portfolio Manager
- Jonathan Strok, CFA - Portfolio Manager
- Jamie Czesak - Investment Analyst
Looking for help navigating your future?
Set up a meeting with your local rep to review your current policies and make sure they're up to date. We pulled together some less obvious reasons to adjust your coverage.
COUNTRY Financial® is a family of affiliated companies (collectively, COUNTRY) located in Bloomington, IL. Learn more about who we are.
1 Based on the MSCI EAFE Gross Index Local and the MSCI Emerging Markets Gross Index Local closing prices.
NOT FDIC-INSURED
May lose value
No bank guarantee
All information is as of the report date unless otherwise noted.
This material is provided for informational purposes only and should not be used or construed as investment advice or a recommendation of any security, sector, or investment strategy. All views expressed and forward-looking information, including forecasts and estimates, are based on the information available at the time of writing, do not provide a complete analysis of every material fact, and may change based on market or other conditions. Statements of fact are from sources considered reliable, but no representation or warranty is made as to their completeness or accuracy. Unless otherwise noted, the analysis and opinions provided are those of the COUNTRY Trust Bank investment team identified above and not necessarily those of COUNTRY Trust Bank or its affiliates.
Diversification, asset allocation and rebalancing do not assure a profit or guarantee against loss. All market indexes are unmanaged, and returns do not include fees and expenses associated with investing in securities. It is not possible to invest directly in an index.
Investment management, retirement, trust and planning services provided by COUNTRY Trust Bank®.
Past performance does not guarantee future results. All investing involves risk, including risk of loss.
Definitions and Important Information
Figure 1: Chart comes from the Federal Reserve Bank of Atlanta.
Figures 2,3,4: Chart data comes from Refinitiv (formerly Thomson Reuters) Datastream, a powerful platform that integrates top-down macroeconomic research and bottom-up fundamental analysis.
Figure 5: The long-term average return data comes from Morningstar and is based upon compound average annual returns for the period from 1926 through December 31, 2020 Stocks are represented by the Ibbotson® Large Company Stock Index, which is comprised of the S&P 500® Composite Index from 1957 to present, and the S&P 90® Index from 1926 to 1956. Bonds are represented by the Ibbotson® U.S. Intermediate-Term Government Bond Index. Cash Equivalents are represented by the 30-day U.S. Treasury bill. The “Balanced Portfolio” is representative of an investment of 50% stocks and 50% bonds rebalanced annually. Forecasted stock returns include small capitalization and international equities. Forecasted bond returns include investment grade corporate bonds. These returns are for illustrative purposes and not indicative of actual portfolio performance. It is not possible to invest directly in an index.
The S&P 500® Index is an unmanaged index consisting of 500 large-cap U.S. stocks. Since it includes a significant portion of the total value of the market, it also considered representative of the market. The index does not reflect investment management fees, brokerage commission and other expenses associated with investing in equity securities. It is not possible to invest directly in an index.
GDP or Gross Domestic Product is the monetary value of all goods and services produced during a specified time period. The figure is used as a barometer of an economy’s health including its size and growth rate. In the U.S., quarterly GDP figures are typically “annualized” meaning the quarterly growth is compounded for four quarters.
The federal funds rate is the interest rate at which depository institutions lend reserve balances to other depository institutions overnight. The Federal Open Market Committee, which is the primary monetary policymaking body of the Federal Reserve, sets its desired target range.
A basis point is equal to one hundredth of one percent. It is used chiefly in expressing differences in interest rates.
The yield curve plots the interest rates of similar-quality bonds against their maturities. The most common yield curve plots the yields of U.S. Treasury securities for various maturities. An inverted yield curve occurs when short-term rates are higher than long-term rates.
The BBB rating is a credit rating used by S&P and Fitch credit rating agencies for long term bonds and some other investments. It is equivalent to the Baa2 rating used by Moody’s. A BBB rating represents a relatively low risk bond or investment. However, it is toward the bottom of investment grade bond ratings, being only two grades above junk bond ratings.
The price-to-earnings ratio is a valuation ratio which compares a company's current share price with its earnings per share (EPS). EPS is usually from the last four quarters (trailing P/E), but sometimes it can be derived from the estimates of earnings expected in the next four quarters (projected or forward P/E). The ratio is also sometimes known as "price multiple" or "earnings multiple."
Stocks of small-capitalization companies involve substantial risk. These stocks historically have experienced greater price volatility than stocks of larger companies, and they may be expected to do so in the future.
Stocks of mid-capitalization companies may be slightly less volatile than those of small-capitalization companies but still involve substantial risk and they may be subject to more abrupt or erratic movements than large capitalization companies.
International investing involves risks not typically associated with domestic investing, including risks of adverse currency fluctuations, potential political and economic instability, different accounting standards, limited liquidity and volatile prices.
Fixed income securities are subject to various risks, including changes in interest rates, credit quality, market valuations, liquidity, prepayments, early redemption, corporate events, tax ramifications and other factors. Debt securities typically decrease in value when interest rates rise. The risk is usually greater for longer-term debt securities. Investments in lower-rated and nonrated securities present a greater risk of loss to principal and interest than higher-rated securities.
Sector investments tend to be more volatile than investments that diversify across companies in many sectors.