Market and Economic Outlook - Released 6/30/26
Key takeaways
- We continue to maintain a small overweight to equities within our multiasset portfolios. We will continue to observe and adapt our views as the data and fundamentals dictate.
- Strong earnings growth has kept valuations for the S&P 500 in line with 5-year averages and keeps us constructive on the investment opportunity within stocks overall.
- Current yield levels provide a durable source of income and a stronger foundation for long-term returns, even if short-term diversification benefits have been less reliable.
On the Fourth of July the United States of America celebrates its semi-quincentennial as it turns 250 years old. We believe this is a fitting opportunity to first take a step back from this quarter’s data and reflect on our history. Our country’s founders took tremendous risks, but successfully built institutions designed to outlast them, made decisions whose rewards they would never personally see, and trusted that their patience and ingenuity would compound over generations. This is, in a way, the same temperament we find that leads to successful investing.
The first 250 years of our nation’s history have not been a linear ascent. The same can be said of our financial markets. The markets have absorbed, among many other crises, wars, a Great Depression, a Great Recession, oil shocks, double digit inflation, and multiple pandemics. Each crisis felt in the moment like it might be the chapter that threw us off course. It is worth noting that all these examples have occurred in just the last 125 years or so, and they have not defined us. We have observed time and time again that markets have proven resilient as they have experienced compounding growth while weathering these proverbial storms.
As we begin the next 250 years, we find ourselves once again battling headlines and crises, this time as it relates to disruption and opportunity from artificial intelligence, war in the Middle East, Federal Reserve regime shifts, and inflationary pressures among other things. Despite these recent challenges, we continue to see opportunities for investors as we navigate these risks. Much like our nation’s history, we do not see this as a smooth or linear path, but despite the volatility, our belief in the resilience and growth of markets persists. We continue to maintain a small overweight to equities within our multi-asset portfolios. We will continue to observe and adapt our views as the data and fundamentals dictate.
Conflict continues
What was supposed to be a short conflict has turned into a more drawn-out war between the U.S., Israel, and Iran. The war started on February 28th, sending oil prices higher with Brent Crude rising over $100 per barrel by the second week of March as the Strait of Hormuz shut down. It stayed above that level through the back half of May before settling in at $71.99 at the end of the second quarter. Gas prices had climbed by 53% through mid-May to $4.50 per gallon before coming back down to under $4 per gallon to end the quarter and were still about 25% higher than prior to the war (Figure 1).
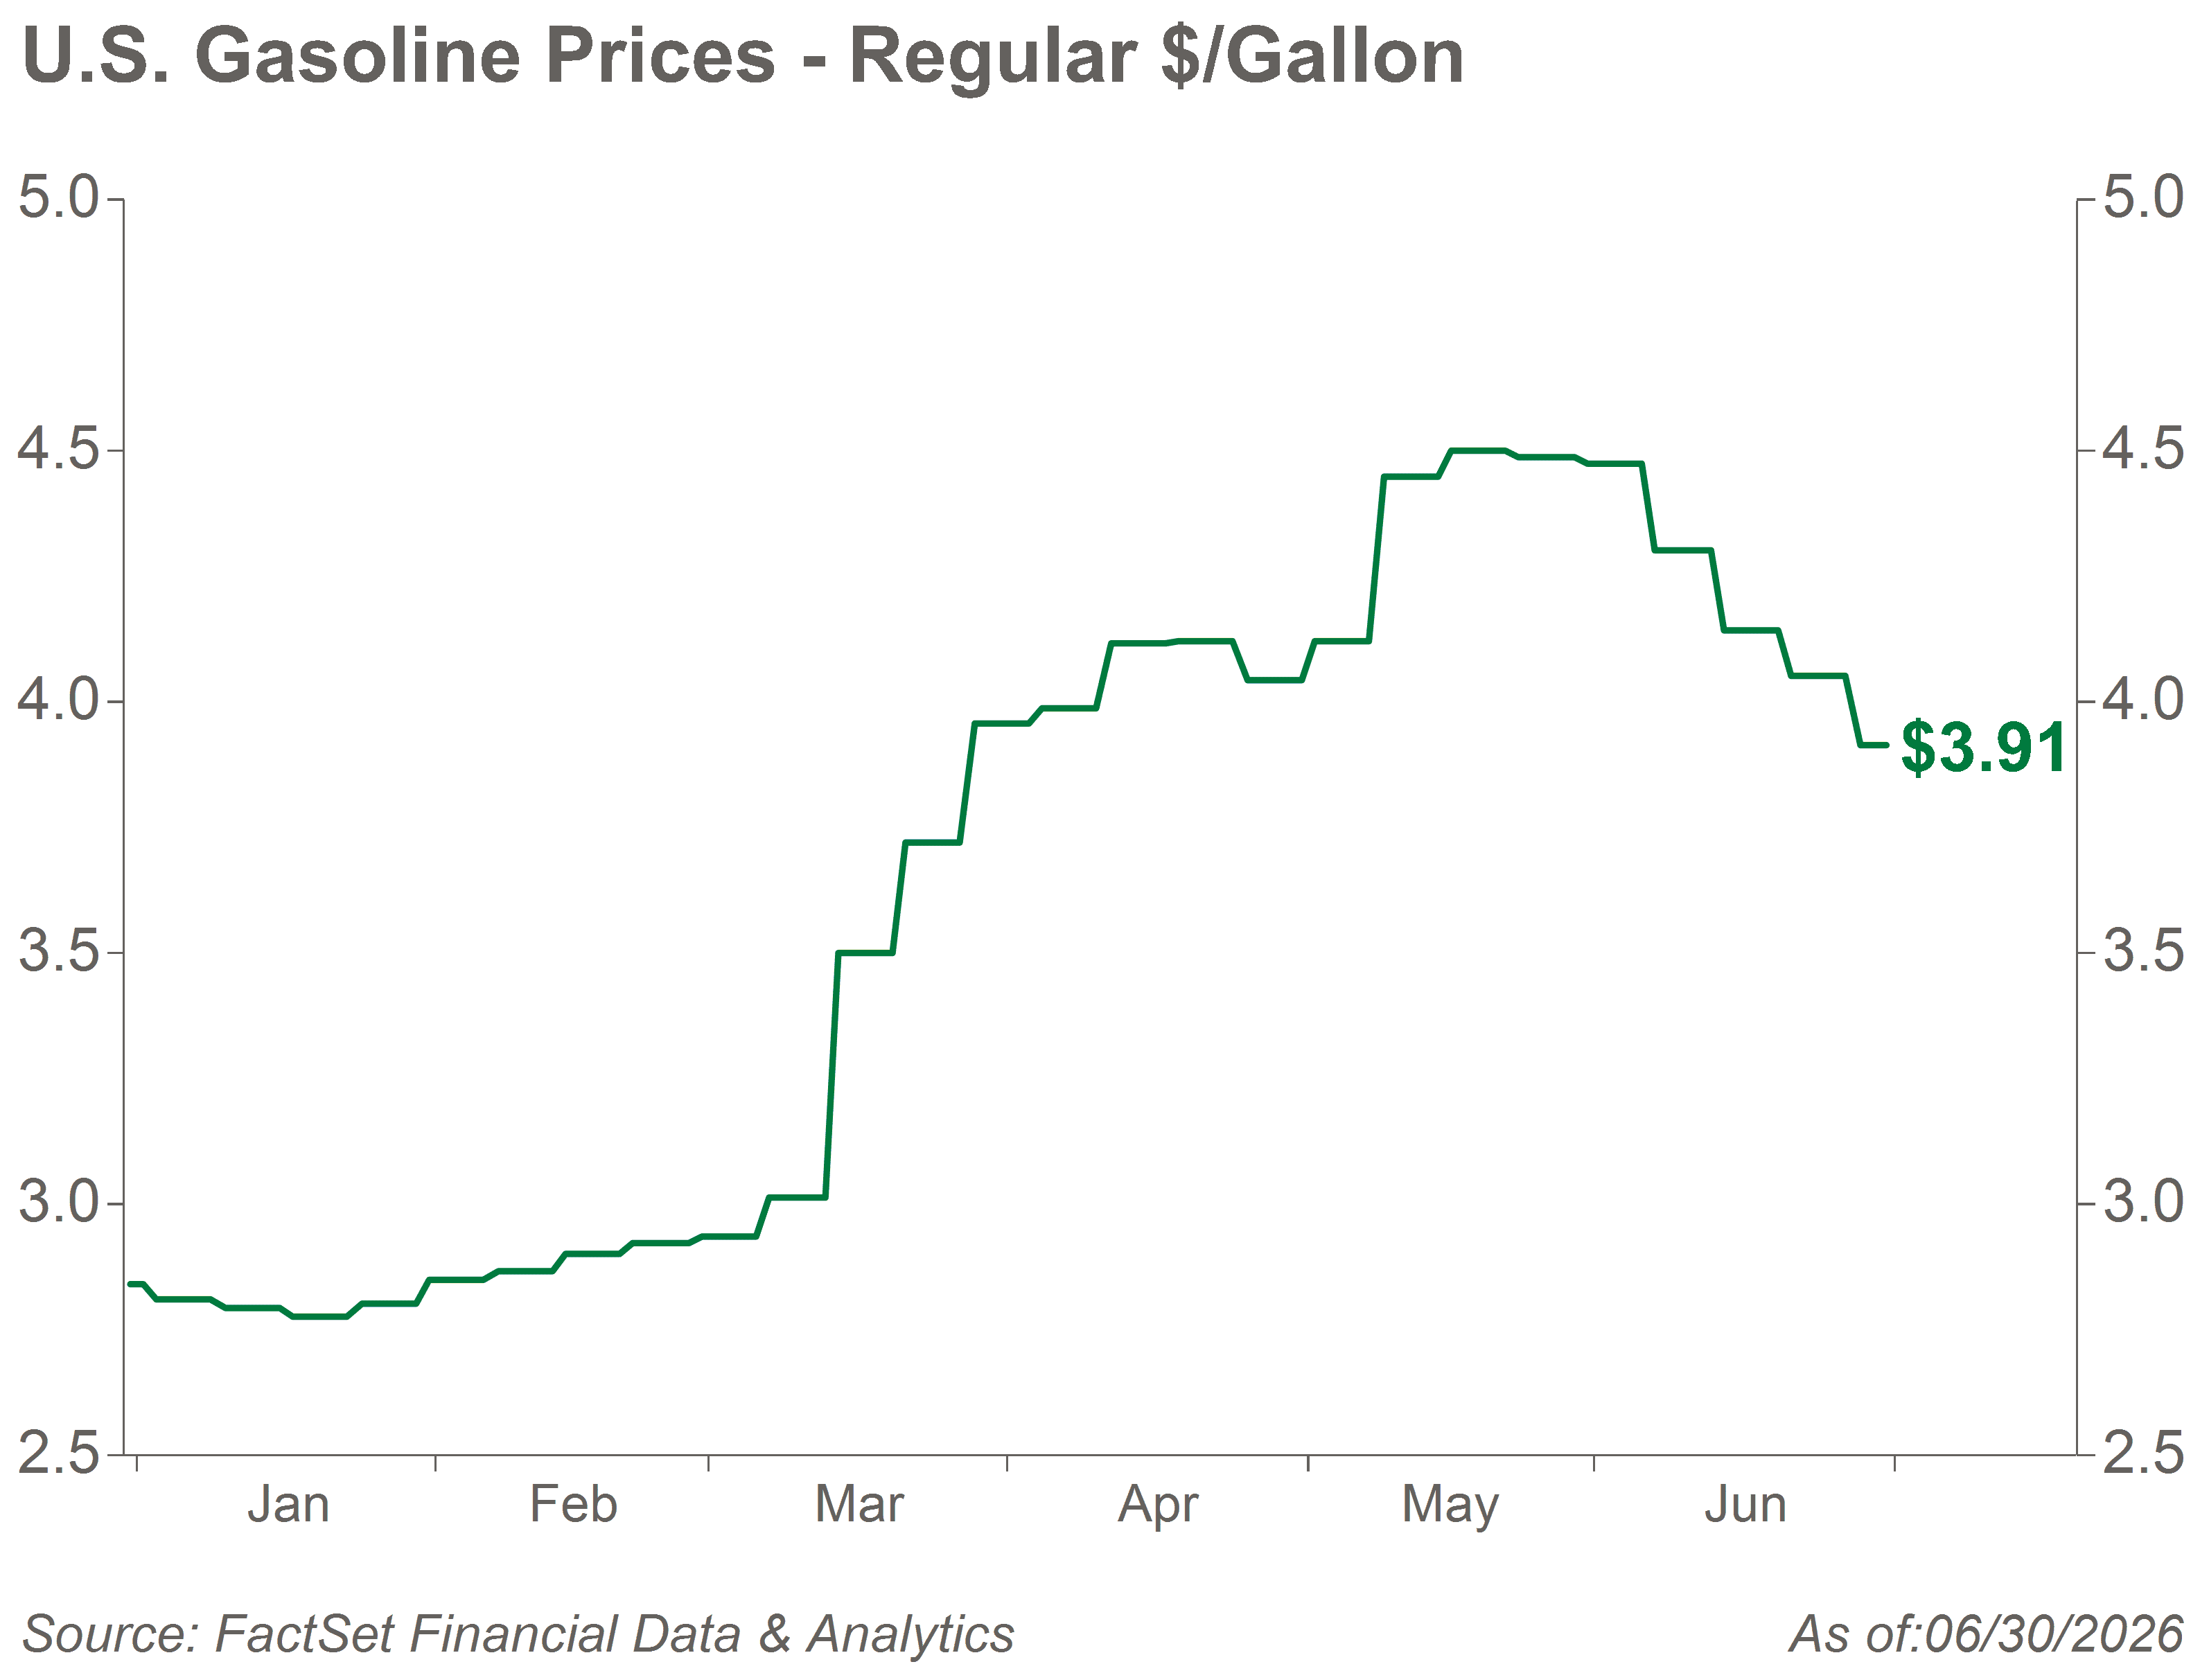 Figure 1
Consumers felt these higher prices at the pump both in their wallets and sentiment. The University of Michigan’s Index of Consumer Sentiment showed some positive improvement as gas came off its highs but remains 13% lower than the February reading prior to the start of the war. This, however, has not stopped consumers from spending. Retail sales rose 1.6% in March, 0.4% in April, and another 0.9% in May. Even when excluding the impact of higher fuel costs, sales rose 0.7%, 0.2%, and 0.7% over those months, respectively. This is due in part to a continued strong labor market where the unemployment rate remains low at 4.3%. And while we read about artificial intelligence (AI) impacting the labor force, we have not yet seen that come through in the form of a higher level of jobless claims.
Oil driving inflation
Oil prices have not only been an issue for consumers, but also for the Federal Reserve. The Federal Open Market Committee (FOMC) noted in both their March and April meetings that the conflict in the Middle East continues to contribute to the higher levels of uncertainty moving forward, and this is particularly true for the impact of oil prices on future inflation. We have seen the Consumer Price Index (CPI) increase from a low of 2.4% in January to 4.2% in May. While higher oil prices have contributed to the rise of CPI, we have also seen Core CPI, which excludes the impact of more volatile food and energy prices, rise from 2.5% to 2.9% during that same period.
The Fed also received its new Chair in Kevin Warsh who presided over his first FOMC meeting in June. The committee elected to hold interest rates in the 3.5% to 3.75% range at both meetings in the quarter, but the press release and conference for the June meeting were both notably shorter with no forward guidance other than the updated dot plot (which Warsh elected to not contribute to) in the Summary of Economic Projections. Moving forward, it is likely we will get less communication from the Fed than we have in the recent past. Markets look to the Fed for guidance on what could be next, and a decrease in communication could mean an increase in volatility. As of now, 17 of the 18 FOMC participants who have submitted their projections to the dot plot at the June meeting expect interest rates to remain the same or increase before the end of the year.
Risk has worked
Markets across the board also remained strong through it all. The S&P 500 Index hit 20 new all-time highs and returned 15.2% during the quarter. April was particularly strong with the S&P 500 showing its best monthly return since November 2020. Small-cap stocks fared even better, rising over 21% in the quarter and widening the gap between large and small U.S. stocks. International developed stocks lagged the U.S., rising 11.1%. However, their emerging market peers led the way returning 24.1%. Bonds returned 0.7%, driven entirely by income as rates rose across much of the yield curve (Figure 2).
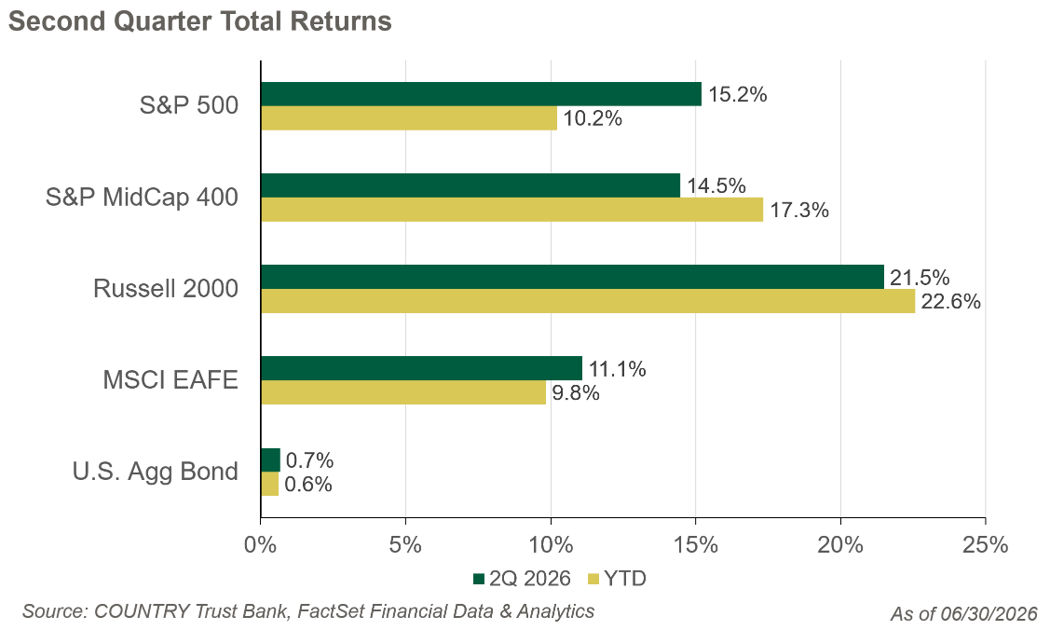 Figure 2
Artificial intelligence, real earnings
All economic sectors in the S&P 500 finished positive in the second quarter except for the Energy and Utilities sectors (Figure 3). Energy declined as oil prices fell from their recent highs while utilities were down marginally against the backdrop of higher interest rates. Stocks tied to the AI theme continued their run of strong returns in the second quarter with Information Technology (IT) stocks up almost 32%. The industrials sector finished next highest, at a distant second to IT, up 14.9%. For the S&P 500 index, earnings growth continues to be a driver of the strong equity returns over the last several years. Year-to-date so far is no exception, as we have seen the earnings estimates for the S&P 500 nearly double since the start of the year according to FactSet data*. Strong earnings growth has kept valuations, as measured by the price-to-earnings ratio, in line with 5-year averages, keeping us constructive on the investment opportunity within stocks overall.
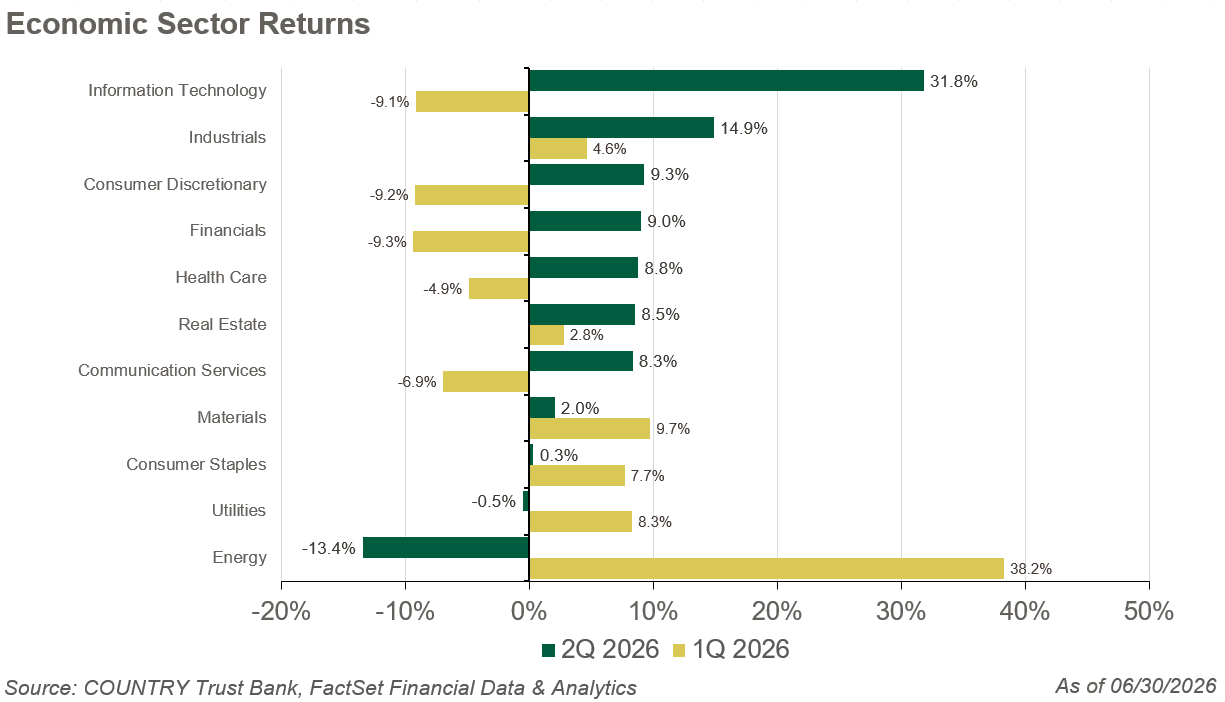 Figure 3
Dynamics of small cap stocks
Our overweight position within small and mid-cap companies, added late in 2025, has been rewarded with strong returns through the first half of 2026, with small and mid-cap indices outpacing their large-cap peers. Against this backdrop of strong returns, we have seen valuations within the Russell 2000, a benchmark of small-cap companies, become more elevated. Looking beneath the surface, a meaningful portion of the benchmark's recent rally has been driven by a relatively narrow group of the largest stocks within the index. Many of these stocks were already at market capitalization sizes more typical of mid- or large-cap companies. This is partly a function of how the index is constructed and the timing of its periodic rebalancing activity, which has allowed several large constituents to remain in the benchmark longer than their current size would suggest. At the same time, leadership within the benchmark has also skewed toward higher volatility and lower profitability stocks.
While the small cap asset class remains attractive to us over longer time horizons, these dynamics reinforce our preference for high-quality and market-capitalization consistent exposure within domestic equities. We acknowledge that these traits have been out of favor, by a wide margin recently as it relates to recent returns seen in some of the small-cap benchmarks, but we believe strong fundamentals will win within small-caps over the long term. Given elevated small cap valuations alongside rising earnings expectations within large caps, we have moved back towards a neutral view between market cap sizes.
Bitcoin flows and IPOs
After a strong recovery in April from its first quarter decline, the price of Bitcoin fell sharply throughout late May and June contributing to its year-to-date return of -33%. According to FactSet data, nearly $4.3 billion has flowed out of Bitcoin related exchange-traded funds (ETFs) so far this year. Despite Bitcoin’s challenges, investor appetite for highprofile investment opportunities remained strong this quarter, perhaps best illustrated by the SpaceX IPO (SPCX). Raising over $85 billion in their initial public offering (IPO), SpaceX saw its shares rally significantly at the opening of trading and hit highs of $225 a share within a few days. SpaceX stock has come down to earth since, having finished the quarter down 24% from its highs, although still above its IPO price.
Asset flows and price action like these examples reflect the dynamic nature of markets and the ever-changing range of investment preferences across participants. Over longer horizons, however, equity returns have historically been most closely tied to underlying fundamentals such as earnings growth, cash flow generation, and durable business models. Regardless of the short-term noise and volatility markets may present, we remain confident that the same temperament that has compounded success over generations such as patience, discipline, and conviction in fundamentals will continue to serve investors well over the long term.
Independence with income
Fixed income markets in the second quarter of 2026 saw a resurgence of volatility, driven by rising interest rates, evolving expectations for central bank policy, and ongoing geopolitical uncertainty. These factors contributed to fluctuations in bond prices and, at times, reduced their effectiveness as a short-term hedge against equity market declines. While the environment may resemble the challenges seen in 2022, the current backdrop for bonds is more favorable from a starting point perspective.
Today’s bond yields are near multi-year highs, standing above both expected inflation and dividend income typically available from equities. This is significant because starting yield is a key determinant of long-term bond returns, with higher yields historically leading to stronger forward performance over subsequent periods. With yields in the upper half of the 4% range, bonds now offer a more compelling income foundation, supporting expectations for mid-single-digit annual returns and reinforcing a 4–6% long-term outlook for fixed income (Figure 4).
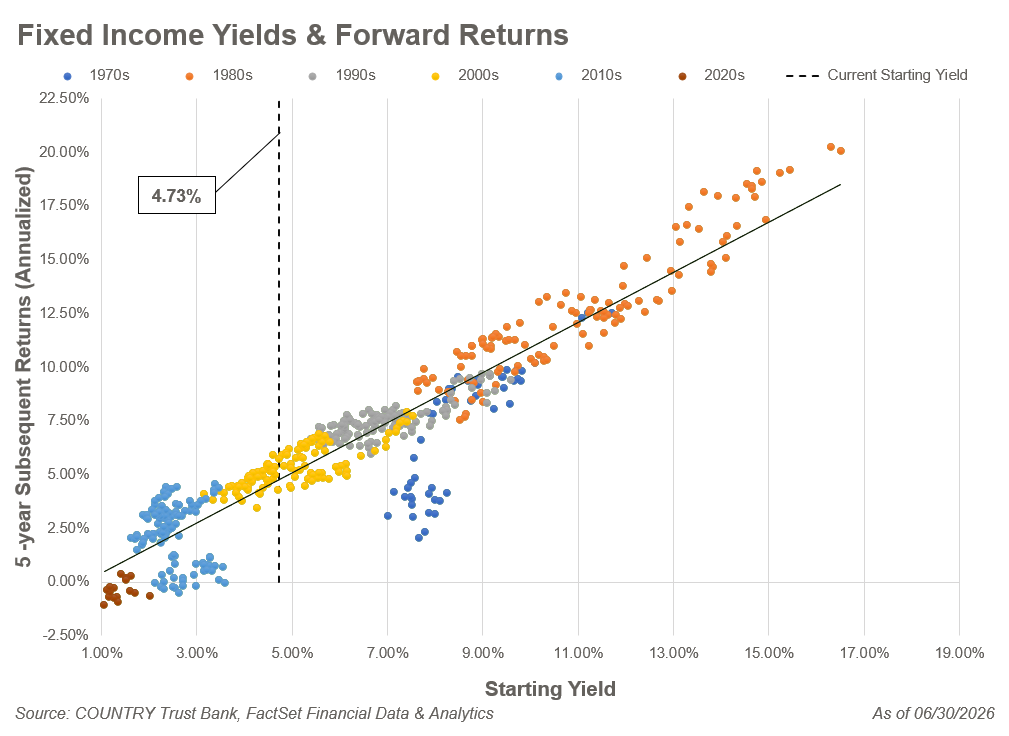 Figure 4
Interest rate movements during the quarter reflected a combination of inflation dynamics, Federal Reserve policy expectations, and changing views on economic growth. Short-term Treasury yields moved higher as persistent inflation, particularly in energy and services, and a more cautious Fed outlook led markets to price in a longer period of elevated policy rates. This repricing contributed to upward pressure on shorter-maturity bonds.
Longer-term Treasury yields also rose during much of the quarter, peaking in mid-to-late May before easing toward quarter-end. The increase was driven by expectations of continued economic resilience and higher term premiums, as investors demanded additional compensation for holding longer-duration assets. Concerns around government borrowing and the long-term inflation outlook added to this pressure. As conditions evolved, moderating inflation expectations helped stabilize longer-term rates, resulting in a modest pullback in yields from the highs by quarter-end.
Debt and credit
We continue to monitor the rising level of government debt globally. When debt is elevated, markets tend to become more sensitive to fiscal developments, as investors often require higher yields to compensate for perceived risks. This dynamic could place upward pressure on interest rates going forward, particularly at the longer end of the yield curve.
Corporate fundamentals remain generally solid, but credit spreads are relatively tight, limiting the additional yield investors earn for taking on credit risk. As a result, parts of the credit market appear somewhat expensive, particularly if economic growth slows, or if persistently high rates begin to pressure weaker borrowers. In this environment, the incremental return from moving down in credit quality is less attractive, reinforcing a preference for higher-quality bonds within portfolios.
In our view, fixed income continues to play an important role in diversification. Current yield levels provide a durable source of income and a stronger foundation for long-term returns, even if short-term diversification benefits have been less reliable. Given this backdrop, we favor maintaining exposure to high-quality bonds, avoiding excessive credit risk, and keeping a neutral approach to duration. Overall, fixed income remains one of the more attractive opportunities in years, offering both income and stability in an uncertain market environment.
The bottom line
As we enter the second half of 2026, we do so during a uniquely symbolic moment in our nation’s history celebrating the 250th anniversary of American independence. For generations, the spirit that shaped this country has been rooted in patience, resilience, and a belief in long-term progress. Those same qualities are at the heart of successful investing. We continue to believe the current landscape supports our forward return expectations within equities and fixed income. As we have observed over time, markets will inevitably face new challenges, and while we cannot predict the timing or nature of the next disruption, we remain committed to navigating it with the same patience, discipline, and long-term perspective that have guided us and our nation throughout history.
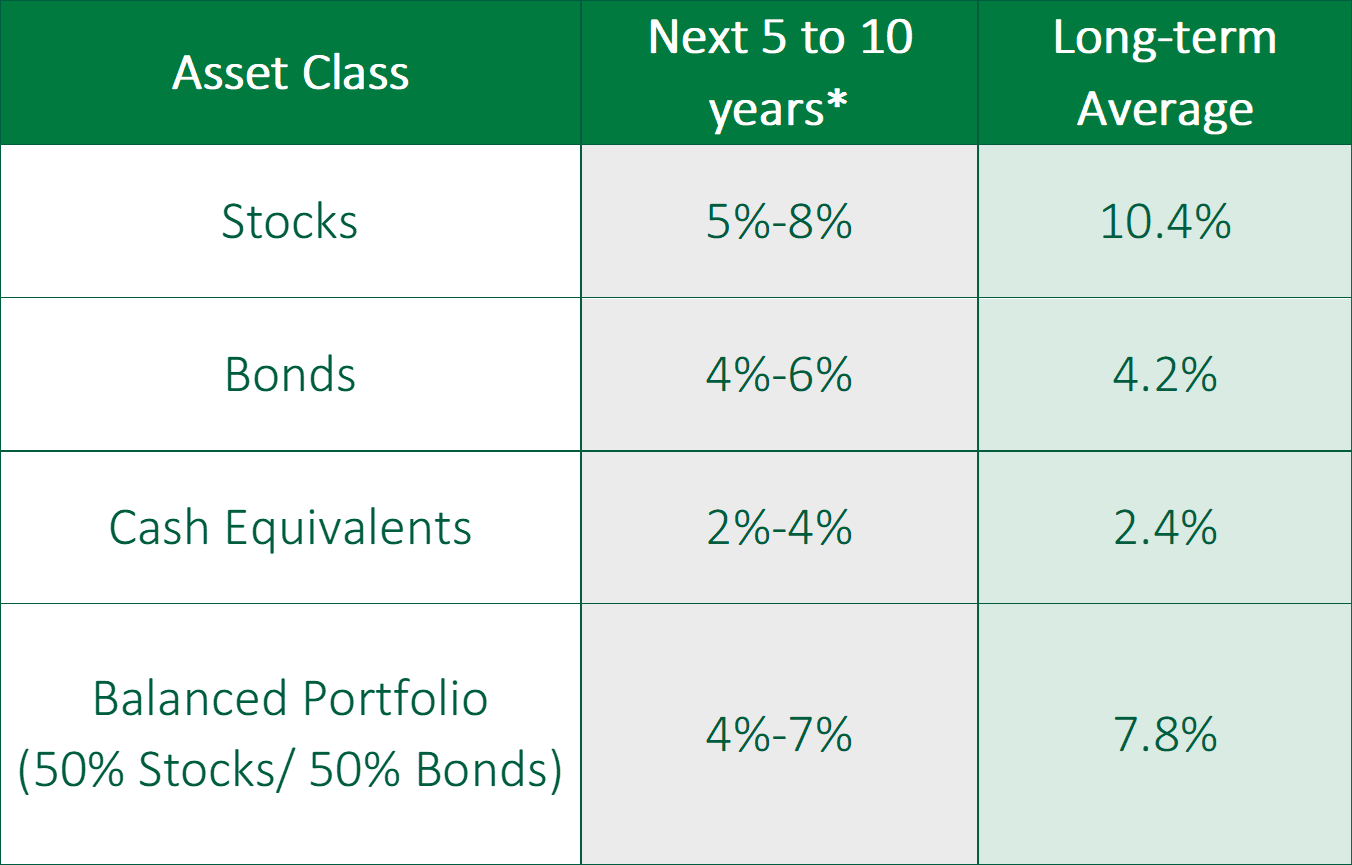 Figure 5
*Forecasted average annual returns from COUNTRY Trust Bank Wealth Management
Source: COUNTRY Trust Bank, FactSet Financial Data & Analytics - See Definitions and Important Information below
COUNTRY Trust Bank® Wealth Management Team
- Troy Frerichs, CFA - VP, Investment Services
- Kent Anderson, CFA - Portfolio Manager
- Weston Chenoweth -Investment Analyst
- Jonathan Strok, CFA - Portfolio Manager
- Michelle Beckler - Investment Analyst
- Jeff Hank, CFA, CFP® - Manager, Wealth Management
- G. Ryan Hypke, CFA, CFP® - Portfolio Manager
- Beau Lartz, ChFC® - Investment Analyst
- Emily Meldrum, CPA - Investment Analyst
- Samantha Reichert - Investment Analyst
Looking for help navigating your future?
Set up a meeting with your local rep to review your current policies and make sure they're up to date. We pulled together some less obvious reasons to adjust your coverage.
COUNTRY Financial® is a family of affiliated companies (collectively, COUNTRY) located in Bloomington, IL. Learn more about who we are.
NOT FDIC-INSURED
May lose value
No bank guarantee
All information is as of the report date unless otherwise noted.
This material is provided for informational purposes only and should not be used or construed as investment advice or a recommendation of any security, sector, or investment strategy. All views expressed and forward-looking information, including forecasts and estimates, are based on the information available at the time of writing, do not provide a complete analysis of every material fact, and may change based on market or other conditions. Statements of fact are from sources considered reliable, but no representation or warranty is made as to their completeness or accuracy. Unless otherwise noted, the analysis and opinions provided are those of the COUNTRY Trust Bank investment team identified above and not necessarily those of COUNTRY Trust Bank or its affiliates.
Diversification, asset allocation and rebalancing do not assure a profit or guarantee against loss. All market indexes are unmanaged, and returns do not include fees and expenses associated with investing in securities. It is not possible to invest directly in an index.
Investment management, retirement, trust and planning services provided by COUNTRY Trust Bank®.
Past performance does not guarantee future results. All investing involves risk, including risk of loss.
Definitions and Important Information
Figures 1,2,3: Data sourced from FactSet Research Systems Inc, a global provider of integrated financial information, analytical applications and services for the investment and corporate communities.
Figure 4: Chart data reflects statistics of Bloomberg US Aggregate Bond index sourced from FactSet. *2020s are from January 2020 to June 2021. Returns are 60 months of forward total returns which are geometrically linked and annualized. Starting Yield reflects month-end YTW. Past performance is not indicative of comparable future results.
Figure 5: The long-term average return data comes from FactSet Research Systems Inc and is based upon compound average annual returns for the period from January 1, 1996 through December 31, 2025. Stocks are represented by the S&P 500® Composite Index. Bonds are represented by the Bloomberg U.S. Aggregate Bond Index. Cash Equivalents are represented by the ICE BofA US 3-Month Treasury Bill Index. The “Balanced Portfolio” is representative of an investment of 50% stocks and 50% bonds rebalanced daily. COUNTRY Trust Bank forecasted stock returns include small capitalization and international equities. Forecasted bond returns include investment-grade bonds as well as below investment-grade bonds. These returns are for illustrative purposes and not indicative of actual portfolio performance. It is not possible to invest directly in an index.
Stocks of small-capitalization companies involve substantial risk. These stocks historically have experienced greater price volatility than stocks of larger companies, and they may be expected to do so in the future.
International investing involves risks not typically associated with domestic investing, including risks of adverse currency fluctuations, potential political and economic instability, different accounting standards, limited liquidity, and volatile prices.
Fixed income securities are subject to various risks, including changes in interest rates, credit quality, market valuations, liquidity, prepayments, early redemption, corporate events, tax ramifications and other factors. Debt securities typically decrease in value when interest rates rise. The risk is usually greater for longer-term debt securities. Investments in lower-rated and nonrated securities present a greater risk of loss.
The yield curve plots the interest rates of similarquality bonds against their maturities. The most common yield curve plots the yields of U.S. Treasury securities for various maturities. An inverted yield curve occurs when short-term rates are higher than long-term rates.
The S&P 500® Index is an unmanaged index consisting of 500 large cap U.S. stocks. The index does not reflect investment management fees; brokerage commission and other expenses associated with investing in equity securities.
The S&P Midcap 400 is a stock market index published by Standard & Poor’s (S&P). It measures the performance of 400 mid-sized companies in the United States, providing a benchmark for this segment of the market. These companies typically have market capitalizations ranging from about $2 billion to $10 billion.
The Russell 2000® Index measures the performance of the small-cap segment of the U.S. equity universe. It includes approximately 2000 of the smallest securities based on a combination of their market cap and current index membership.
The MSCI EAFE Index measures international equity performance. It comprises the MSCI country indexes capturing large and mid-cap equities across developed markets in Europe, Australasia, and the Far East, excluding the U.S. and Canada.
The MSCI Emerging Markets Index captures large and mid-cap representation across 23 emerging market countries. The index covers approximately 85% of the free float-adjusted market capitalization in each country.
The Bloomberg Aggregate Bond Index, often referred to as “the Agg,” is a broad-based benchmark that measures the performance of the U.S. investment-grade bond market. It includes a wide range of fixed-income securities.
Brent Crude is a globally recognized benchmark grade of crude oil, sourced from the North Sea, used as a primary reference for international oil pricing (quoted per barrel). University of Michigan Index of Consumer Sentiment — A monthly survey-based gauge of U.S. consumers' attitudes about their personal finances, business conditions, and the broader economy, used as an indicator of consumer confidence and potential spending behavior.
*FactSet Research Earnings Scorecard for the S&P 500 projected 2026 earnings growth of 12.15% as of 12/31/2025 while now projecting earnings growth of 23.89% as of 6/30/2026.
The price-to-earnings ratio is a valuation ratio which compares a company's current share price with its earnings per share (EPS). EPS is usually from the last four quarters (trailing P/E), but sometimes it can be derived from the estimates of earnings expected in the next four quarters (projected or forward P/E). The ratio is also sometimes known as "price multiple" or "earnings multiple."
The federal funds rate is the interest rate at which depository institutions (like banks and credit unions) lend reserve balances to other depository institutions overnight on an uncollateralized basis. This rate is a key tool of U.S. monetary policy, set by the Federal Open Market Committee (FOMC) of the Federal Reserve. Changes in the federal funds rate can influence various economic factors, including inflation, employment, and the rates on consumer loans and mortgages.
Yield to Maturity (YTM) represents the total rate of return an investor can expect from a bond if they hold it until maturity and reinvest all interest payments at the same rate. It’s expressed as an annual percentage.
Yield to Worst (YTW) represents the lowest potential rate of return an investor can expect on a bond without the issuer defaulting, accounting for features such as call or prepayment provisions that could shorten the bond's life. It is expressed as an annual percentage.
Credit spreads measure the difference in yields between bonds with the same maturity but different credit quality.
Duration — A measure of a bond's (or bond portfolio's) sensitivity to changes in interest rates; the longer the duration, the greater the price impact from a given rate move.
Consumer Price Index (CPI) — A measure of the average change over time in the prices paid by consumers for a representative basket of goods and services; a common gauge of inflation.
Core CPI — A version of the Consumer Price Index that excludes the more volatile food and energy components to provide a clearer read on underlying inflation trends.