Market and Economic Outlook - Released 6/30/23
Key Takeaways:
- It is still difficult to decipher whether economic data are normalizing back to trend or if a recession is to come. We believe it makes sense to position multi asset portfolios neutrally between stocks and bonds.
- Small and mid-sized companies have reasonable valuations compared to their larger peers. However, we believe stock portfolios should be positioned for a wide array of risks.
- We expect a more stable interest rate environment during the second half of the year but feel bond investors are best served by structuring their portfolio for a variety of economic scenarios
In August of 1979, BusinessWeek magazine infamously declared “The Death of Equities…. How Inflation is Destroying the Stock Market.” Of course, this bold prediction turned out to be wrong as the S&P 500 has experienced significant gains since. Attention grabbing news headlines have existed throughout history. They tend to be most impactful when the economic data is conflicting. In 2023, the 24-hour news cycle can overwhelm us with a variety of opinions on the current state of the economy. Despite all the information at our fingertips today, financial market projections are just as uncertain as they were in 1979. You could surmise, with investing, the more things change the more they stay the same.
Our clients ask us to manage their assets amidst all the uncertainty which comes with long-term investing. Whether it’s the debt ceiling debate, an upcoming election, inflation, interest rates or geopolitical risk there is never a shortage of possibilities to consider. There is no magic formula that leads to immediate success, however, as investing is difficult, and requires discipline and a conscious effort to succeed. Our mission is to build portfolios that try to navigate a wide variety of risks by evaluating the current investment landscape, look to find undervalued assets, and invest in these areas in a diversified way.
Keeping this core philosophy in mind, we believe today there is not a compelling reason to take more risk than needed to achieve your investment goals. Stock market valuations don’t appear cheap particularly if we enter a period of economic weakness. However, bond yields are still a bright spot in our view, and we continue to believe it makes sense to balance our risks by positioning multi asset portfolios neutrally between stocks and bonds.
Inflation Down but Not Out
As in 1979, investors continue to grapple with elevated inflation readings. Even after increasing the Fed Funds rate 5% over the last 15 months, the Federal Reserve's job of dampening inflation is not complete. Central banks around the globe have been raising rates to battle inflationary pressures. While the U.S. Consumer Price Index (CPI) has declined from its peak of 9.1% to 4.1% (Figure 1), it is still well above the Fed’s target. It has been said monetary policy works with long and variable lags, but many are asking how much further the Fed will have to raise interest rates and what impact that will have on the economy. It is still difficult to decipher whether economic data are normalizing back to trend or if a recession is to come.
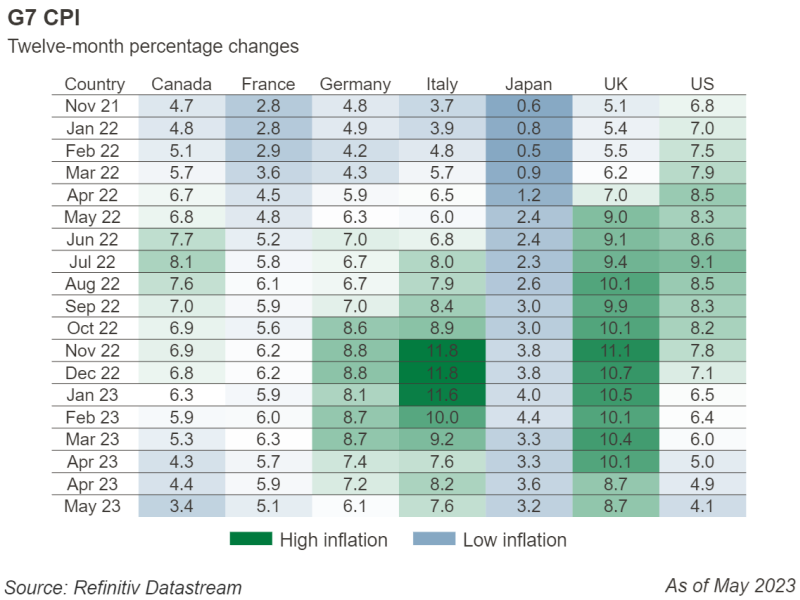 Figure 1
Mixed Economic Data
The Fed’s decision to raise rates has begun to slow the economy. Initial jobless claims have increased, the manufacturing sector is in contraction and the Conference Board’s Leading Economic Index (LEI) is showing weakness with a decline each of the past 14 months. However, this has not been enough to significantly affect GDP. Growth in the first quarter was 2.0% and the Atlanta Fed’s GDP Now forecast is for 2.2% in the second quarter this year even with the LEI down almost 8% over the past year (Figure 2). The unemployment rate remains exceptionally low, despite initial jobless claims starting to trend up. Wage growth has remained above historical trends, and if consumers have jobs, they will continue to spend as consumer spending makes up the vast majority of GDP.
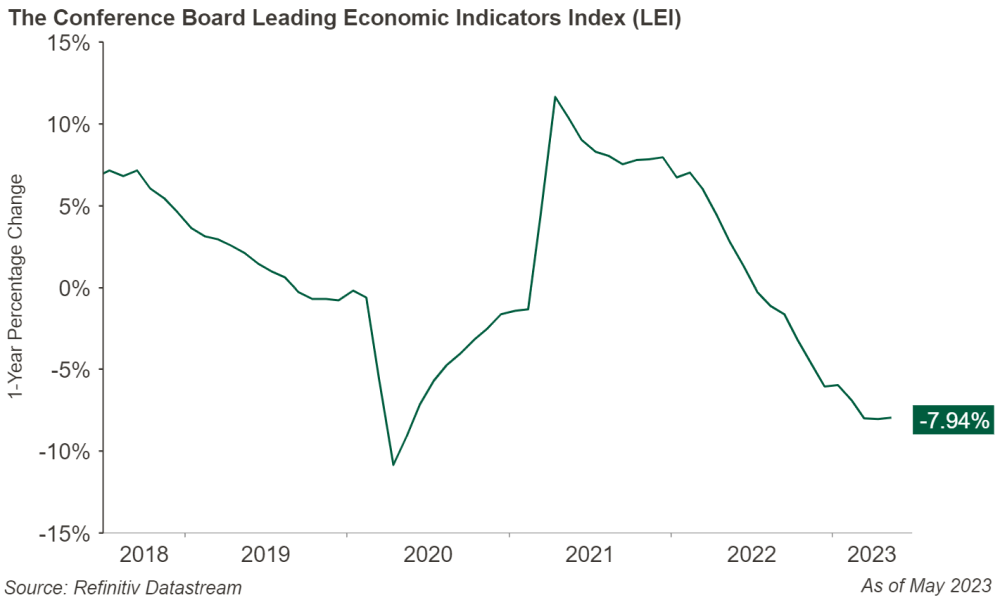 Figure 2
The Fed has said they believe more rate hikes will be necessary at upcoming meetings and potentially as early as their next meeting in July. While inflation appears to have quickly receded, looking under the hood suggests that core inflation could level off for some time in the 4%-5% range and need further actions to combat it if the economy does not slow further.
What is not clear is the degree of impact the rate increases will have as the lagged effects are just now coming through. Even with numerous leading indicators suggesting recession is on the horizon, markets have shrugged this off and continued their march upward (albeit with little breadth as explained below). U.S. large cap stocks led the way this quarter with the S&P 500 index rising 8.7% while their small cap counterparts were up 5.2%. International developed stocks were up 3.2% and emerging markets contributed 1.0% to the mix. U.S. bonds were down -0.9% (Figure 3).
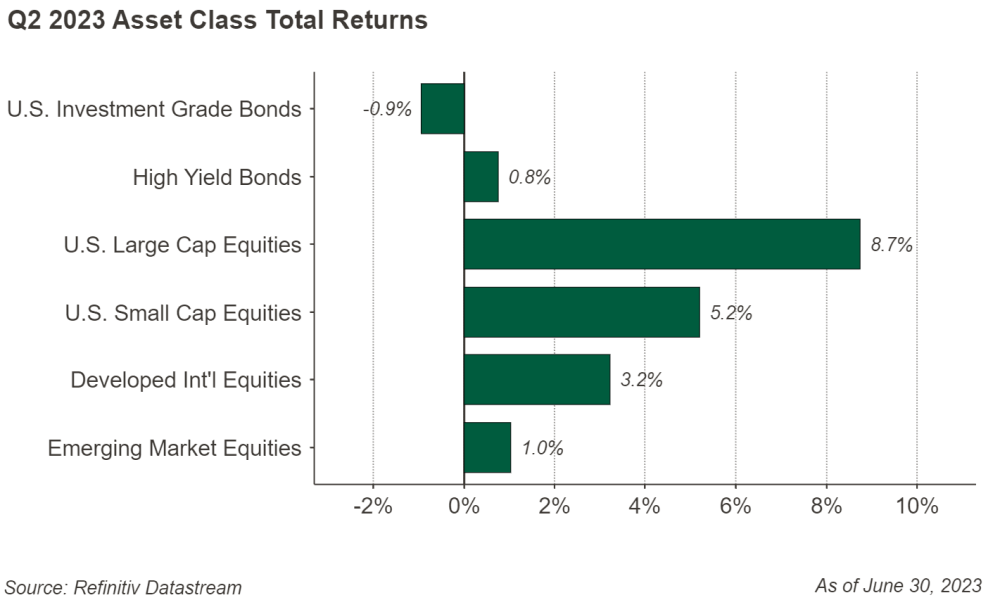 Figure 3
Bad Breadth
The narrow breadth of stock market returns we saw in the first quarter continued into mid-year, meaning that a sizable part of the S&P 500’s rally was concentrated on a few of the largest stocks in the index. To put that into perspective, we saw the aggregate market value of the 7 largest stocks in the index at quarter end (Apple, Microsoft, Alphabet/Google, Amazon, Nvidia, Meta/Facebook and Tesla) surged 59.3% year to date, while the remaining 493 stocks have only grown 3.9% during the same period (Figure 4). In fact, 38% of the 500 stocks in the index have negative total returns year to date contributing to the meager growth of those names outside the top 7.
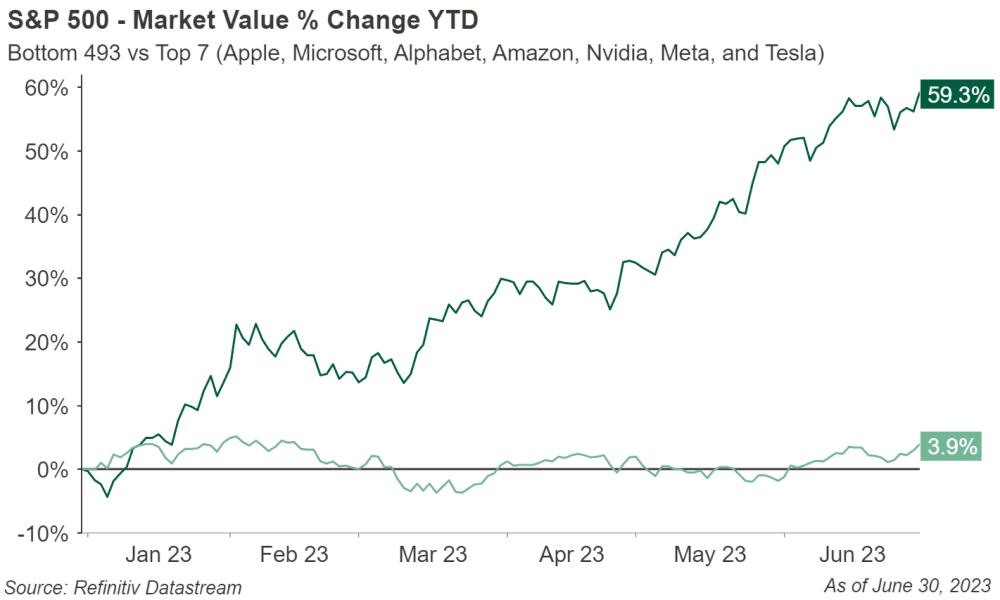 Figure 4
With the returns referenced above setting the stage, the common arguments for what is driving this disparity include recent market interest in stocks with exposure to artificial intelligence (AI), and the market looking past recent rhetoric from the Federal Reserve and seeing an eventual end of the rate hike cycle leading to a growth stock rally. In our view, both arguments create thought provoking discussions, but currently, we opt to take the conservative side of these trades. Since current trends in AI appear to be in the first stages of its development, it is highly likely there will be winners and losers, and currently the market is pricing all of them at premium valuations as if they will all be winners in tandem. Federal Reserve commentary has recently been hawkish, despite the pause in June, which leads us to believe hikes are not yet over. Additionally, earnings expectations for the S&P 500 have declined slightly this year. These risks demonstrate our conservative positioning.
Small, Mid and Non-U.S.
As the largest stocks have gotten more expensive, we find ourselves looking down the market capitalization spectrum, into small and mid-sized companies that have more reasonable valuations. This does not mean abandoning large capitalization peers entirely as we feel creating portfolios that position for a wide variety of risks is vital. Momentum certainly could continue to drive returns in these large and growthy tech stocks longer than what may seem reasonable, and there is also a possibility their projected growth exceeds expectations which may eventually justify the higher prices.
We also continue to remain neutral on international stocks despite more attractive valuations as we watch for trends in the US dollar and its impact abroad (Figure 5). Geopolitical events particularly in Russia may continue to impact investor sentiment and pose additional risks to consider.
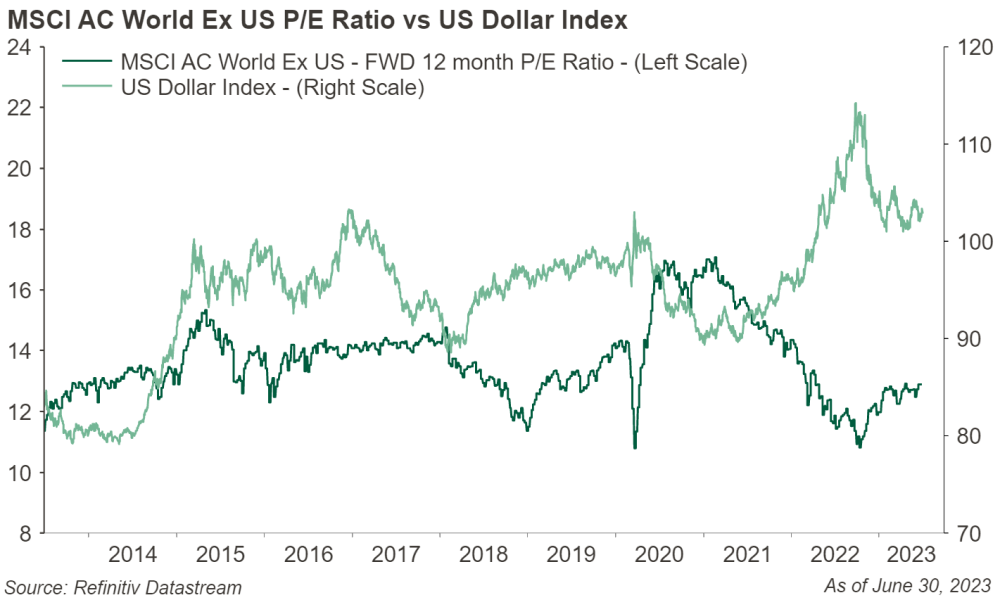 Figure 5
Bonds and Rates
The investment grade bond investors' environment is still promising. The yield to maturity on the Bloomberg Aggregate Bond Index is near 4.8% as of quarter end. Yields on investment grade corporate bonds are near their highest levels since the global financial crisis in 2008-2009 (Figure 6).
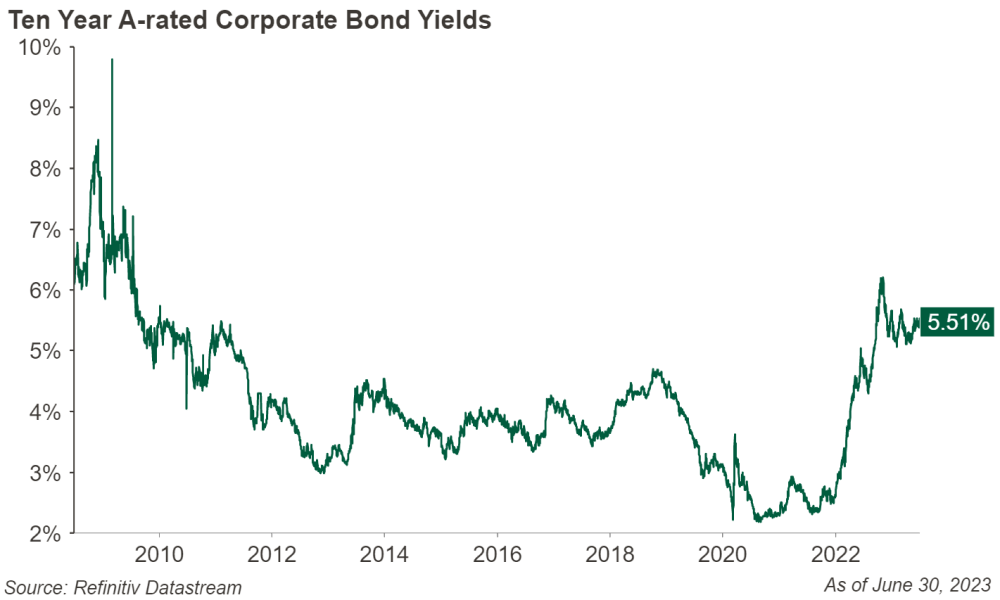 Figure 6
We believe the Fed seems to be nearing the end of its campaign to raise interest rates but the odds of rate cuts later in the year are declining. Nonetheless, we expect a more stable interest rate environment during the second half of the year. However, interest rate moves are notoriously difficult to predict, and we feel bond investors are best served by structuring their portfolio for a variety of economic scenarios.
Inverted Curve with Stable Credit Spreads
The Treasury yield curve is still deeply inverted. Lower longer-term rates signal the bond market believes the Fed will get inflation under control (Figure 7).
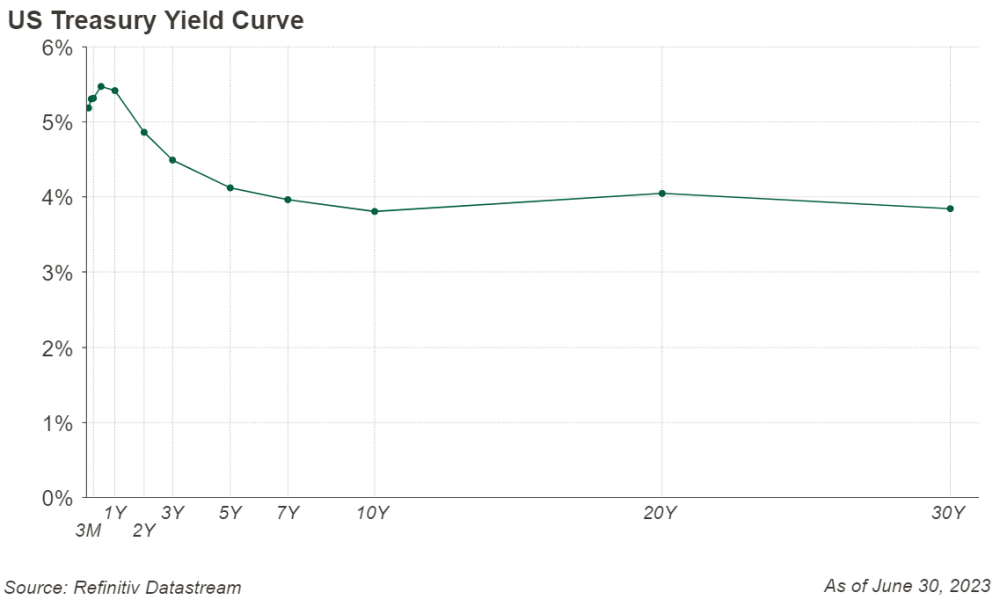 Figure 7
While investors can earn attractive yields on cash equivalents today, longer duration bonds historically have outperformed cash when the Fed is cutting rates. We are positioning bond portfolios to have duration, or measure of sensitivity of a bond’s price to changes in interest rates, to be in line with the intermediate term investment grade bond market. If a recession occurs, and inflation drops at a faster rate than expected, longer duration bonds could benefit.
Credit spreads, or the difference in the yield of two bonds with the same maturity but different credit quality, have remained stable. We feel there is a chance they begin to widen during the second half of 2023 as the economy digests the lagged impact of rate hikes. We recommend bond investors don’t take more credit risk today. If we enter an economic slowdown over the next year, we believe this will provide a more attractive opportunity to invest in nontraditional income sectors like bank loans, preferred stocks, and emerging markets debt within bond portfolios at wider spreads to Treasury bonds.
The Bottom Line
Over the years, the one constant in investing is an uncertain future. Often, messages from the financial market “experts” forecasting short term market moves can be confusing. We prefer to tune out and focus on what we can control. Finding a level of risk which makes sense based on your long-term financial plan and staying fully invested according to that plan is still as relevant today as ever. These core principles will go a long way during periods when the noise coming from financial markets seems louder than normal.
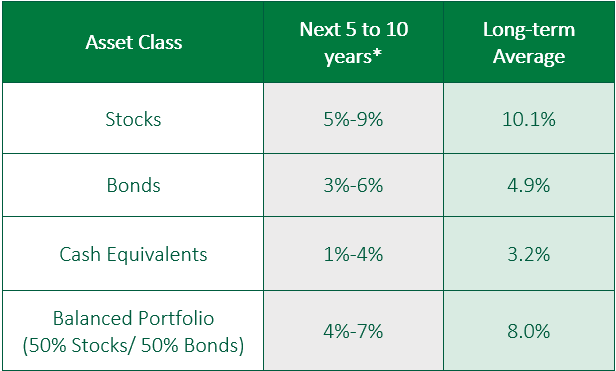 Figure 8
*Forecasted average annual returns of COUNTRY Trust Bank Wealth Management
Source: Morningstar and COUNTRY Trust Bank® - See Definitions and Important Information below
COUNTRY Trust Bank® Wealth Management Team
- Troy Frerichs, CFA - VP, Investment Services
- Jeff Hank, CFA, CFP® - Manager, Wealth Management
- G. Ryan Hypke, CFA, CFP® - Portfolio Manager
- Weston Chenoweth - Investment Analyst
- Beau Lartz, ChFC® - Investment Analyst
- Cody Behrens, ChFC® - Investment Analyst
- Chelsie Moore, CFA, CFP® - Director, Wealth Management & Financial Planning
- Kent Anderson, CFA - Portfolio Manager
- Jonathan Strok, CFA - Portfolio Manager
- Michelle Beckler - Investment Analyst
- Samantha Reichert - Investment Analyst
Looking for help navigating your future?
Set up a meeting with your local rep to review your current policies and make sure they're up to date. We pulled together some less obvious reasons to adjust your coverage.
COUNTRY Financial® is a family of affiliated companies (collectively, COUNTRY) located in Bloomington, IL. Learn more about who we are.
NOT FDIC-INSURED
May lose value
No bank guarantee
Investment management, retirement, trust and planning services provided by COUNTRY Trust Bank®.
Past performance does not guarantee future results. All investing involves risk, including risk of loss.
All information is as of the report date, unless otherwise noted.
This material is provided for informational purposes only and should not be used or construed as investment advice or a recommendation of any security, sector, or investment strategy. All views expressed and forward-looking information, including forecasts and estimates, are based on the information available at the time of writing, do not provide a complete analysis of every material fact, and may change based on market or other conditions. Statements of fact are from sources considered reliable, but no representation or warranty is made as to their completeness or accuracy. Unless otherwise noted, the analysis and opinions provided are those of the COUNTRY Trust Bank investment team identified above and not necessarily those of COUNTRY Trust Bank or its affiliates.
Diversification, asset allocation and rebalancing do not assure a profit or guarantee against loss. All market indexes are unmanaged, and returns do not include fees and expenses associated with investing in securities. It is not possible to invest directly in an index.
Definitions and Important Information
Figures 1,2,3,4,5,6,7: Chart data comes from Refinitiv (formerly Thomson Reuters) DataStream, a powerful platform that integrates top-down macroeconomic research and bottom-up fundamental analysis.
Figure 8: The long-term average return data comes from Morningstar and is based upon compound average annual returns for the period from 1926 through December 31, 2022. Stocks are represented by the Ibbotson® Large Company Stock Index, which is comprised of the S&P 500® Composite Index from 1957 to present, and the S&P 90® Index from 1926 to 1956. Bonds are represented by the Ibbotson® U.S. Intermediate-Term Government Bond Index. Cash Equivalents are represented by the 30-day U.S. Treasury bill. The “Balanced Portfolio” is representative of an investment of 50% stocks and 50% bonds rebalanced annually. Forecasted stock returns include small capitalization and international equities. Forecasted bond returns include investment grade corporate bonds. These returns are for illustrative purposes and not indicative of actual portfolio performance. It is not possible to invest directly in an index.
The S&P 500® Index is an unmanaged index consisting of 500 large-cap U.S. stocks. Since it includes a significant portion of the total value of the market, it also considered representative of the market. The index does not reflect investment management fees, brokerage commission and other expenses associated with investing in equity securities. It is not possible to invest directly in an index.
The Bloomberg U.S. Aggregate Bond Index is an unmanaged index that covers the USD-denominated, investment-grade, fixed rate, taxable bond market of securities. The Index includes bonds from the Treasury, Government-Related, Corporate, MBS, ABS, and CMBS sectors.
Stocks of small-capitalization companies involve substantial risk. These stocks historically have experienced greater price volatility than stocks of larger companies, and they may be expected to do so in the future.
International investing involves risks not typically associated with domestic investing, including risks of adverse currency fluctuations, potential political and economic instability, different accounting standards, limited liquidity, and volatile prices.
Fixed income securities are subject to various risks, including changes in interest rates, credit quality, market valuations, liquidity, prepayments, early redemption, corporate events, tax ramifications and other factors. Debt securities typically decrease in value when interest rates rise. The risk is usually greater for longer-term debt securities. Investments in lower-rated and nonrated securities present a greater risk of loss to principal and interest than higher- rated securities.
The yield curve plots the interest rates of similar-quality bonds against their maturities. The most common yield curve plots the yields of U.S. Treasury securities for various maturities. An inverted yield curve occurs when short-term rates are higher than long-term rates.
The federal funds rate is the interest rate at which depository institutions lend reserve balances to other depository institutions overnight. The Federal Open Market Committee, which is the primary monetary policymaking body of the Federal Reserve, sets its desired target range.
The price-to-earnings ratio is a valuation ratio which compares a company's current share price with its earnings per share (EPS). EPS is usually from the last four quarters (trailing P/E), but sometimes it can be derived from the estimates of earnings expected in the next four quarters (projected or forward P/E). The ratio is also sometimes known as "price multiple" or "earnings multiple."
The Conference Board Leading Economic Index is an American economic leading indicator intended to forecast future economic activity. It is calculated by The Conference Board, a non-governmental organization, which determines the value of the index from the values of ten key variables.
GDPNow is not an official forecast of GDP from the Atlanta Fed. It is best used as viewed as a running estimate of real GDP growth based on available economic data for the current measured quarter. There are no subjective adjustments made to GDPNow the estimate is based solely on the mathematical results of the model. Data as of March 31, 2023
The Consumer Price Index (CPI) is a measure of the average change over time in the prices paid by urban consumers for a market basket of consumer goods and services. Indexes are available for the U.S. and various geographic areas
Credit spreads measure the difference in yields between bonds with the same maturity but different credit quality.
The yield to maturity (YTM) is the total rate of return that will be earned by a bond when it makes all interest payments and repays the original bond if held to maturity.