COUNTRY Trust Bank® Special Report - Financial Planning Insights: Remaining Invested Through Market Cycles
Investing your hard earned money in the market can cause many people to wonder if they’re doing the right thing. Remaining invested though market cycles can be even more challenging. In fact, it seems like almost every day there is a new issue to be concerned about. In the short-term, these concerns can weigh especially heavy on our minds. This leaves a lot of people wondering the same thought, “is it truly best to remain invested in the market right now?”
To answer that, you may first want to consider why you’re invested in the first place. For many people, this is to help fund their ideal life. Take a moment to imagine the life you want today and in the future. What are you doing? Who are you with? How are you going to get there? While there are other options, a common method of saving to support longterm goals is to invest your money in a portfolio that matches the needs of those goals.
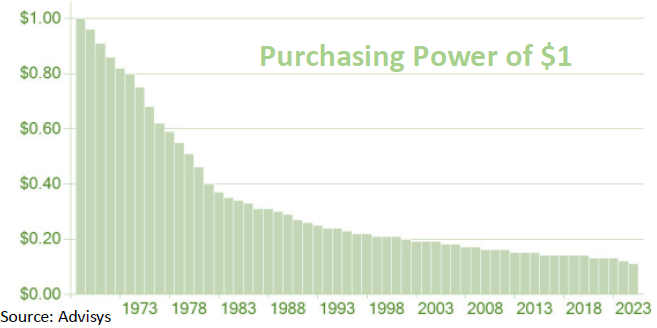
If you’re 100% confident that you have enough money to fund your ideal life now, and in the future, then it might make sense to avoid investing your money. Instead, you could keep it all in cash, bank deposits, or something similarly secure. Keep in mind that leaving your money in cash will cause you to lose purchasing power over time. The cost of your expenses are going to increase over time with inflation. Most things cost more money today than they did five years ago. Although you might not see the dollar amount in your cash accounts go down, the amount that you can purchase with your cash will continue to decrease until you may no longer be able to cover your essential expenses. A properly diversified investment portfolio has historically been an efficient method to outpace inflation in the long-term. With proper planning, you may have the funds to not just pay for your lifestyle today but also 10, 20, or 30 years from now.
In the short-term, the markets can swing up or down dramatically. The S&P 500 index is one of the longest running and most popular metrics to gauge the markets. In March of 2020 the S&P was down 34% from it’s high. By the end of 2020, the S&P closed at a positive 16.3%. That’s a roughly 50% swing within one year, with a quick recovery from the bottom.
Although the markets move dramatically year-to-year and sometimes even day-to-day, that movement tends to become less extreme when we look at longer time segments. By zooming out a few years we start to see a cycle in the markets.
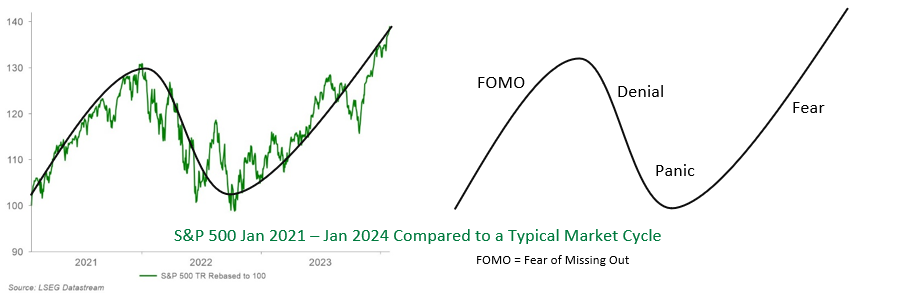
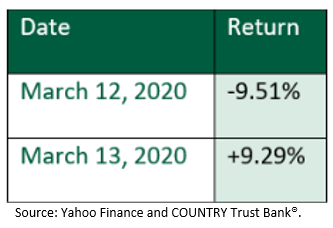
It is easy to become blind to these longer term patterns and get swept up in the day-to-day movement. This may happen when news headlines manipulate us to fear losing everything, or alternatively, fear of missing out on potential returns. This, in-turn, clouds our judgement. We end up putting more weight in the short-term rather than the long-term pattern. Some may even end up taking action based on these reactions from the headlines rather than their plan to support their long-term goals. When this happens, people panic and shift their money from investments to cash. Now, they have to try and time the market correctly twice: the time at which they move out of the market and the time they move back into the market. How much did the market climb after
they pulled out? How much did the market climb while they were afraid to get back in? History shows that some of the best days are often right after some of the worst days, making it impossible to consistently time the market.
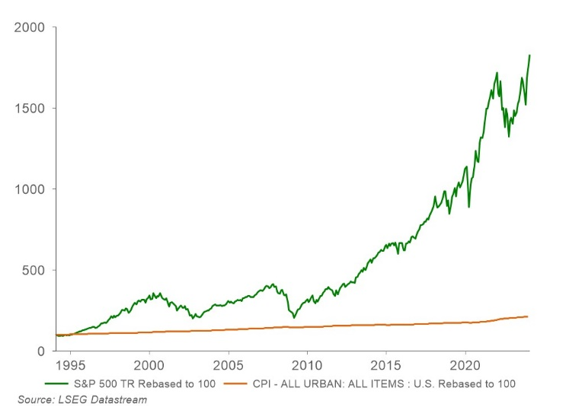
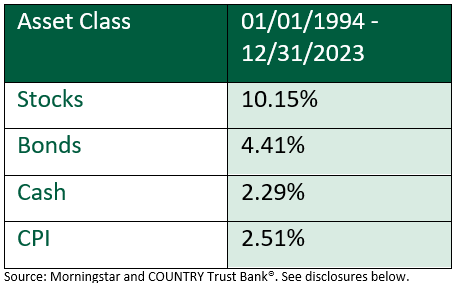
Just being aware of the market cycle compared to the typical reactions caused by the excitement and stress produced by short-term current events can help you make better decisions. It’s also helpful to consider how the markets typically perform on a longer time horizon. For example, even though the S&P 500 has had some years that are negative, the average return per year is 10.15% over the past 30 years. Consumer Price Index (CPI), a way to measure rising costs of goods, has been 2.51% over the same time frame.
For many, a drop in the market is still a painful experience even when they fully understand that market downturns are a normal part of the market cycle. It can still be tempting to jump from one asset class that is currently performing poorly into a different asset class that is currently performing well. However, this often leads someone to sell an asset at a lower price and buy a different asset at a higher price. This is the opposite of what many of us intend to do.
As noted above, moving all of your money from investments into cash often ends in a poor result. Historically this has also been true with other asset classes as well. The top performing asset class in one year may be the worst performing asset class in the next year. For example, according to Callan’s Periodic Table of Investment Returns, Emerging Market Equity, (represented by MSCI Emerging Markets index) had a return of 37.28% in 2017 - the best performing asset class that year. The following year, it was down -14.57% making it the worst performing asset class for the year. Since it’s impossible to consistently predict which asset class will be the best or worst year-to-year, a properly diversified portfolio may help reduce overall risk by spreading investments across different asset classes. While you may notice that your properly diversified portfolio of investments won’t always reach the same highs as a more concentrated portfolio, it can help reduce your risk of large drops. Since a large drop in your portfolio can be more painful than the joy of a large gain, this strategy can be a key factor towards staying invested through the market cycle.
If you want to weather any storm, you need to be prepared. It’s best to prepare with a plan to take advantage of the long-term returns and manage short-term movement. Remember that life you imagined and set your financial goals to support that life. Then, build a financial plan to support those goals. The money you’ll need in the short-term should be invested in less risky investments. Money for the long-term can be invested in the market but should follow an Investment Policy Statement to ensure your money is invested in line with your financial plan, goals, and risk tolerance.
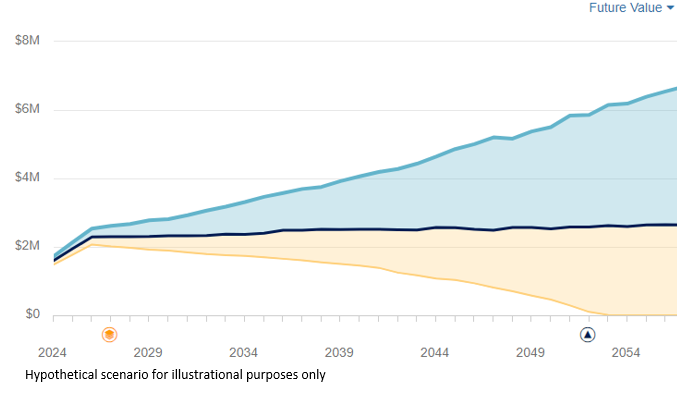
A proper financial plan can provide analysis to help you understand how your investments fit into the bigger picture of your financial story. By layering in income sources, expenses, and other variables, you can view how your portfolio might perform going forward in average markets, better than average markets, or below average performing markets. Being aware of how market fluctuations can affect your portfolio and overall financial plan might reduce stress and anxiety. It may also provide insight to plan ahead for any flexibility that may be needed.
Reviewing your financial plan every year could help you feel even more comfortable with staying invested. Reviewing a plan will help you see how much the current market movement has impacted your financial plan. You may find that your plan is still in a better position than you originally assessed, even with a drop in the market. Alternatively, you may see that the market has made an impact to your plan. By catching this early, you may be able to make a small change rather than a drastic change later on. For example, you could implement the use of a buffer asset. A buffer asset is an asset that has a low correlation with the market. These assets may help mitigate the impact that a drop in the market has on your life.
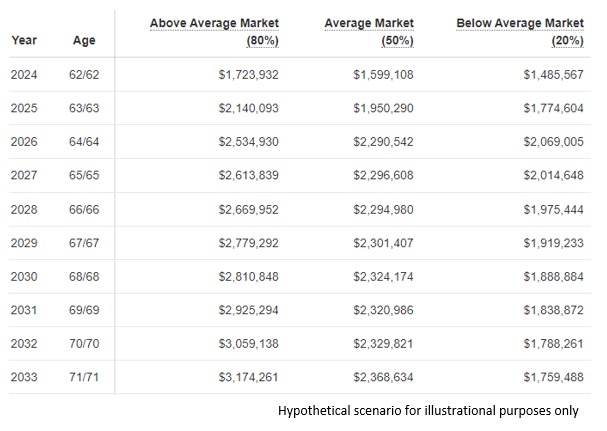
A financial advisor can work with you to assess your goals and risk tolerance to help you develop a financial plan. The analysis of your plan can give you the information you need to decide if it’s best for your long term goals to stay invested.
When the markets dip, take a moment to reflect on what’s most important to you. Did the life you want in the future change at all? Did something change about your goals? How is your health and your family? Are current events causing anxiety? Is this leading you to put more focus on short-term rather than the long term? Remember, you may find peace of mind by tuning out the news and other noise and reviewing your financial plan. Creating a plan and giving your money an opportunity to work for you allows you to take control of your own success.
COUNTRY Trust Bank® Wealth Management Team
- Bryan Daniels, CFP®, MPAS®, ChFC®, CLU®, AFFP, AWMA®, ADPA®, CMFC®
- Nick Erwin, CFP®, BFA®, ChFC®, CLU®, AFFP
- Scott Jensen, CFP®, ChFC®, CLU®, RICP®, AFFP
- Lorraine Zenge, AFFP
Looking for help navigating your future?
Set up a meeting with your local rep to review your current policies and make sure they're up to date. We pulled together some less obvious reasons to adjust your coverage.
*The long-term average return data comes from Morningstar and is based upon compound average annual returns for the period from 01/01/1994 through 12/31/2023. Stocks are represented by the S&P 500® Composite Index. Bonds are represented by the Bloomberg US Agg Bond Index. Cash Equivalents are represented by the 30-day U.S. Treasury bill. (CPI) is represented by the Consumer Price Index. These returns are for illustrative purposes and not indicative of actual portfolio performance. It is not possible to invest directly in an index.
COUNTRY Financial® is a family of affiliated companies (collectively, COUNTRY) located in Bloomington, IL. Learn more about who we are.
NOT FDIC-INSURED
May lose value
No bank guarantee
Investment management, retirement, trust and planning services provided by COUNTRY Trust Bank®.
*The long-term average return data comes from Morningstar and is based upon compound average annual returns for the period from 01/01/1994 through 12/31/2023. Stocks are represented by the S&P 500® Composite Index. Bonds are represented by the Bloomberg US Agg Bond Index. Cash Equivalents are represented by the 30-day U.S. Treasury bill. (CPI) is represented by the Consumer Price Index. These returns are for illustrative purposes and not indicative of actual portfolio performance. It is not possible to invest directly in an index.
Past performance does not guarantee future results. All investing involves risk, including risk of loss.
Diversification, asset allocation and rebalancing do not assure a profit or guarantee against loss. All market indexes are unmanaged, and returns do not include fees and expenses associated with investing in securities. It is not possible to invest directly in an index.
This material is provided for informational purposes only and should not be used or construed as investment advice or a recommendation of any security, sector, or investment strategy. All views expressed and forward-looking information, including forecasts and estimates, are based on the information available at the time of writing, do not provide a complete analysis of every material fact, and may change based on market or other conditions. Statements of fact are from sources considered reliable, but no representation or warranty is made as to their completeness or accuracy. Unless otherwise noted, the analysis and opinions provided are those of the COUNTRY Trust Bank investment team identified above and not necessarily those of COUNTRY Trust Bank or its affiliates.
This information is not intended as and should not be construed to provide tax or legal advice. It is intended as an educational starting point to help you better understand an array of common tax-related aspects. COUNTRY Trust Bank and its employees do not provide tax advice. This information may omit some important aspects of tax or legal conditions, which is why it is important to seek out the advice of qualified tax or legal counsel of your choice regarding your personal circumstances.