Market and Economic Outlook - Released 3/31/26
Key takeaways:
- Markets have seen many pullbacks and corrections over the years with many different catalysts. These have historically been followed by a recovery and new market highs.
- We remain constructive on the outlook for stocks and their ability to deliver attractive returns going forward. Profit margins are attractive demonstrated with the S&P 500 Index approaching 2022 highs.
- Demand for high‑quality bonds has helped anchor returns. The role of bonds is a source of dependable income and is an important stabilizing element within a diversified portfolio.
The first quarter of 2026 has delivered steady economic progress alongside rising uncertainty. Inflation has eased meaningfully from its peak and remains well below prior highs, though it remains above the Federal Reserve’s 2% target. Job growth is slowing not because the economy is weakening, but because fewer workers are entering the labor force, and businesses are hiring more cautiously. At the same time, geopolitical tensions in the Middle East, particularly involving critical shipping routes, have increased volatility in oil and gas markets, complicating the inflation outlook. These crosscurrents make the Fed’s task more challenging, as efforts to support growth and employment now carry a renewed risk of reigniting price pressures.
Howard Marks, co-founder of Oaktree Capital and one of the most widely respected long-term bond investors, has often noted that “the biggest investing errors come not from factors that are informational or analytical, but from those that are psychological.” Periods like this reinforce that uncertainty is not a flaw of investing, but a defining feature of it. Markets can react quickly to unexpected events, and those moments often create both risks and opportunities for disciplined investors.
Despite a more unsettled economic and geopolitical backdrop, financial markets have remained resilient. U.S. equities continue to trade near recent highs, supported by solid corporate earnings and broader participation across sectors. International markets, along with small- and mid‑capitalization stocks, have also shown improved momentum. Performance has become more balanced, with sectors tied to physical assets and traditional business models helping to broaden market leadership beyond the largest technology companies.
At this point, we have not seen meaningful changes in valuations or investor sentiment that would warrant significant portfolio adjustments. As a result, we remain comfortably positioned maintaining a modest equity overweight within our multi-asset portfolios. Should market volatility create more attractive entry points, or should valuations shift materially, we are prepared to adjust our positions as conditions evolve.
Tariffs take a back seat
Entering the year, markets were fully expecting the Federal Reserve to cut interest rates two or three times in 2026. As we approached the end of the quarter, markets were no longer pricing in any rate cuts by year end, and the probability of a rate increase had moved to over 30%. By the end of the quarter, expectations for a rate increase had faded away according to CME FedWatch. What caused this constant shift in expectations, and how have markets reacted?
Over the first two months of the year, expectations remained relatively stable for the Federal Open Market Committee (FOMC) to initiate further rate cuts by mid-year. We had believed this would be the case as well with the assumption that the Fed would give us a break at the beginning of the year before proceeding to cut rates. At their first two rate setting meetings this year in January and March, the FOMC elected to hold the fed funds rate in a target range of 3.5% to 3.75%.
Tariff uncertainty remained at the forefront with the Supreme Court ruling in February that the tariffs issued under the International Emergency Economic Powers Act (IEEPA) were illegal. President Trump’s response included a global 15% tariff on all goods. Thus far, the rate currently in effect under Section 122 of the Trade Act of 1974 is 10%. Tariff news was seemingly put on the backburner by investors at the end of February when the Iran war began sending oil prices higher. Both Brent crude oil and West Texas Intermediate (WTI) reached over $119 per barrel in March (from under $60 at the beginning of the year), marking their highest levels since 2022. Inflation concerns rose along with the price of oil, stock markets dropped, and interest rates rose to their highest levels since last July.
Today, our expectation is that a 25 basis point rate cut is still on the table and the probability of a rate cut is higher than what markets would suggest. There is also the chance for the Fed to hold rates steady throughout the year, though we assign a slightly lower probability to this outcome.
We’ve been here before
The market this year has not been dissimilar to the start of 2025 as it pertains to the S&P 500 Index. Looking at a chart from the first quarter of last year and comparing it to this year, January started off strong before monthly losses in February and March. Tariffs drove much of the selloff last year, and this year it has been conflicts in the Middle East. By the end of the first quarter last year, we saw a correction in the S&P 500 when it declined by over 10% from the quarter’s peak. This year, we have seen a peak-to-trough decline of 9.1%. The S&P 500 Index ended each quarter down 4.3%.
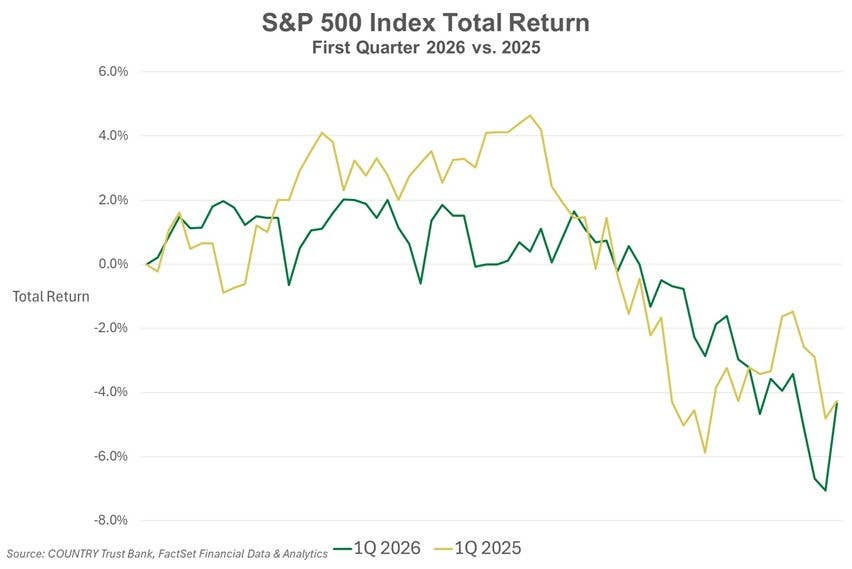 Figure 1
There are a few differences between this year and last as well. While the S&P 500 has seen a dip in the quarter, small and mid-cap companies are faring much better, posting positive returns. International developed stocks are down on the quarter compared to a large run up last year. Emerging market stocks were down 0.1% this quarter versus a 3% return for the same period last year.
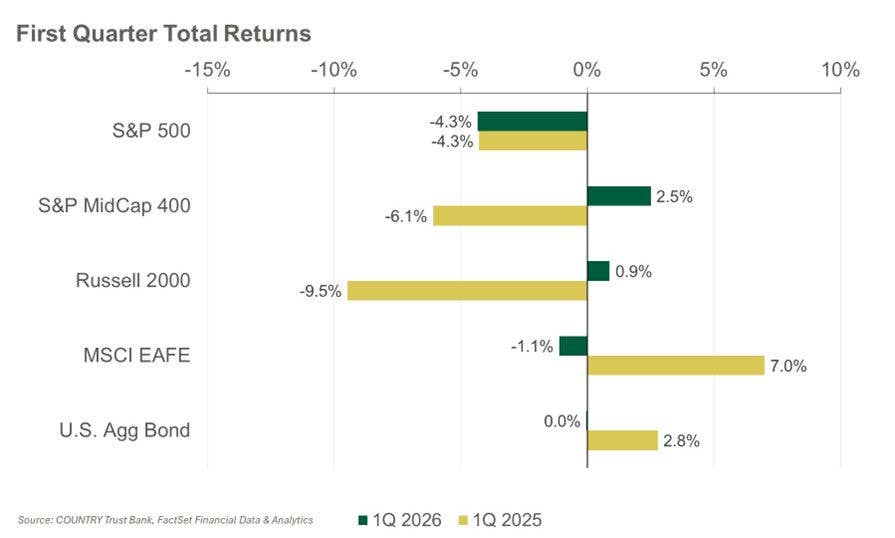 Figure 2
Geopolitical conflicts, oil price spikes, and other headlines can take a near-term toll on the market, while longer-term they generally do not create significant disruptions. Going back to 2015, we have seen fourteen 5%+ pullbacks from the recent all-time closing highs in the S&P 500 Index, six 10%+ corrections, and two 20%+ bear markets. While market drawdowns can make investors anxious, pullbacks (5% decline from a recent high) and even corrections (10% decline from a recent high) are common. On the flip side, from the beginning of 2015, the S&P 500 Index has seen more than 300 new all-time closing highs. Thus far this year, we have experienced six all-time intraday highs and four new closing highs (all coming in January). This tempo of declines followed by new highs is very likely to continue into the future. Maintaining a steady allocation to stocks and bonds and not attempting to time the market’s ups and downs tend to be the best way to catch all the new highs.
Broad dispersion in stock market returns
While the ending negative performance during the quarter for the S&P 500 was not outsized, it doesn’t necessarily tell the whole story. Looking under the surface of total benchmark returns, there was a tremendous dispersion in the returns within economic sectors and the various industries that comprise them. For example, Energy was the standout sector, returning 38.2% during the quarter, while Financials was the worst performing sector, which declined 9.3%, a difference of over 47% over a 3-month period.
The proliferation of Artificial Intelligence (AI) continued to drive some of this dispersion as the market attempts to distinguish companies and industries that may be winners and losers from continued evolution of AI. Software and IT services stocks within the information technology sector, for example, both declined over 20% on fears that AI solutions would render many software and services obsolete. We also saw construction and engineering companies rally 32.8% during the quarter as a presumed benefactor in the tremendous capital investment being made to support AI through data center and energy infrastructure construction. We saw volatility around this theme throughout the quarter as semiconductor stocks, the industry which includes companies like Nvidia Corporation, dropped 10% from their late February highs. An end-of-quarter surge eventually led this industry to finish the quarter down only 2.6%. In our view, the implications of AI are not linear, and while there will be winners and losers over time, we continue to find opportunities even within industries whose share prices have been recently disrupted by the manifestation of AI. Beyond AI, industries such as the oil gas & consumable fuels industry were up nearly 40%, supported by rising crude oil prices amid geopolitical tensions stemming from military action in Iran and the broader Middle East.
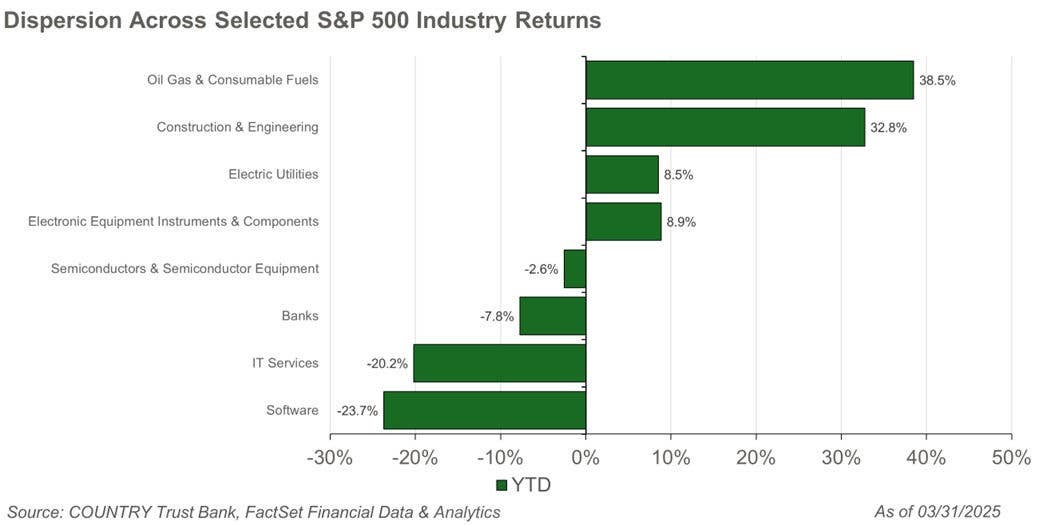 Figure 3
While the start of 2026 has resulted in a broad rotation of returns across industries and asset classes due to several factors, we continue to remain constructive on the outlook for stocks and their ability to deliver attractive returns going forward. What keeps us constructive are the attractive profit margins demonstrated by the S&P 500 Index as they have continued to remain resilient, approaching 2022 highs, as earnings and profitability within large cap stocks continue to be strong. Attractive valuations and earnings growth expectations among small and mid-cap stocks lead us to maintain a slight preference for companies lower on the market capitalization spectrum. We believe these dynamics have contributed to their relative strength to start the year with both asset classes finishing the quarter with positive returns. We continue to maintain a neutral allocation between U.S. and international stocks. The U.S. dollar has strengthened to start the year following last year’s weakness which dampened returns for U.S. investors investing overseas.
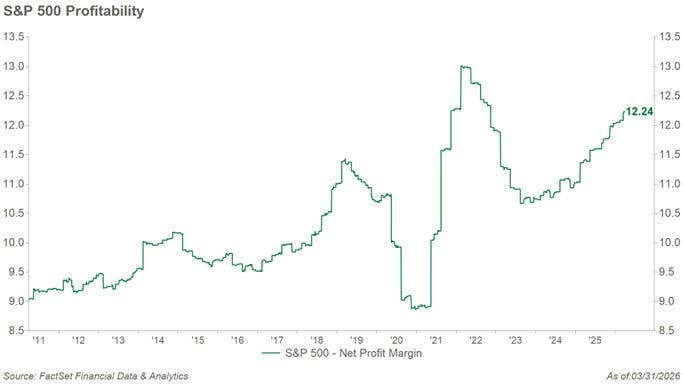 Figure 4
Alternative assets in view
While precious metals such as gold and silver surged early in the year, they lost momentum toward the end of March. Despite one of the worst months for gold in 20 years, gold managed to finish up 7.4% for the quarter. Bitcoin continued its decline into the new year, finishing the quarter down 22.1%. While we understand the investment cases often cited for these asset classes, we believe that their recent performance highlights that their return behavior can differ meaningfully from commonly held expectations for them across various market environments. As a result, we continue to focus on cash flow–generating assets, such as stocks and bonds, which we believe support long-term returns driven by strong underlying fundamentals.
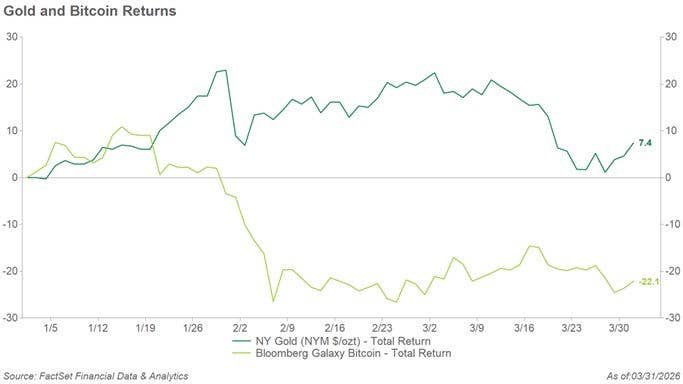 Figure 5
Income leads
The bond market entered 2026 on solid footing, with income expected to play a significant role in driving returns. After years of unusually low interest rates, today’s higher yields allow investors to earn meaningful income without relying on large price gains. That said, the market has been less steady than initially appeared, as renewed volatility driven by inflation concerns, geopolitics, and shifting Federal Reserve expectations has led to wider price swings.
Even in this more unsettled environment, strong demand for high‑quality fixed income has helped anchor returns, reinforcing the role of bonds as a source of dependable income and is an important stabilizing element within a diversified portfolio. Corporate bond issuance was strong to start the year, with companies expected to issue more than $2 trillion in 2026. Investors have eagerly bought these new bonds, showing solid demand for high quality fixed income. This demand comes even though credit spreads—the extra yield investors earn for taking company-specific risk—are near historically low levels. Lower rated and high yield bonds have benefited from a resilient economy, but the compensation for taking extra-credit risk remains limited in our view.
The 10‑year Treasury yield traded mostly in a narrow 4.00%–4.25% range throughout the first quarter before drifting even higher toward quarter‑end. Renewed inflation concerns have pushed short‑term interest rates up, lowering expectations for near‑term Federal Reserve rate cuts. One unexpected development this quarter was the lack of a typical “flight to safety” which is a pattern where investors usually buy more U.S. Treasuries during geopolitical uncertainty. Instead, rising oil prices increased inflation worries, leading investors to focus more on the risk of higher future yields rather than seeking safety in government bonds.
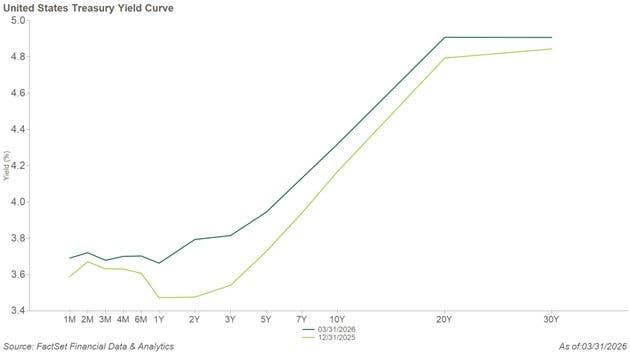 Figure 6
Storms brewing?
Private credit continues to attract attention as risks could increase. The asset class has grown rapidly since the financial crisis and has not yet been tested through an economic downturn. Borrowers face higher refinancing costs, and some industries, especially those exposed to AI-driven disruption, may see more stress. Recent headlines about liquidity issues and valuation concerns suggest the potential for volatility or forced selling among large institutional investors. It is still unclear whether these pressures will spill over into traditional investment grade bonds or remain isolated.
Given today’s tight spreads, geopolitical uncertainty, and the potential for inflation shocks particularly from energy prices, we continue to favor high quality bonds, neutral interest rate positioning, and a disciplined focus on generating reliable income. We have kept our portfolios focused on high‑quality investment‑grade bonds, which offer dependable income with relatively low risk. At the same time, we have reduced our exposure to areas that are more complex or carry higher risks such as preferred securities, bank loans, and emerging‑market debt. These types of investments can behave differently from traditional bonds and often take on more credit or economic risk, so we believe a more conservative approach is appropriate in the current environment.
The bottom line
Despite ongoing economic uncertainty, shifting labor trends, and elevated geopolitical risks, the overall market backdrop has proven more resilient than the headlines might suggest. Strong corporate earnings, improved market breadth, and attractive income from bonds continue to support diversified portfolios. While volatility may remain elevated, driven by energy prices, AI‑related disruptions, and policy uncertainty, diversification and a long‑term mindset remain the most reliable tools for navigating challenging market conditions. Periods of unpredictability are a normal part of investing, and history reminds us that patience and discipline tend to win over time.
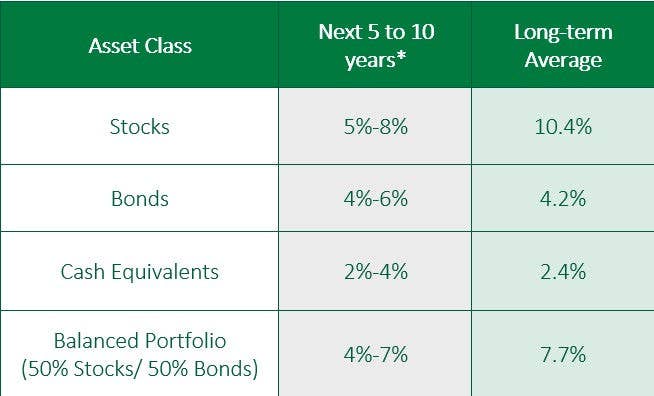 Figure 7
*Forecasted average annual returns of COUNTRY Trust Bank Wealth Management
Source: Morningstar and COUNTRY Trust Bank® - See Definitions and Important Information below
COUNTRY Trust Bank® Wealth Management Team
- Troy Frerichs, CFA - VP, Investment Services
- Jeff Hank, CFA, CFP® - Manager, Wealth Management
- G. Ryan Hypke, CFA, CFP® - Portfolio Manager
- Beau Lartz, ChFC® - Investment Analyst
- Emily Meldrum, CPA - Investment Analyst
- Chelsie Moore, CFA, CFP® - Director, Wealth Management & Financial Planning
- Kent Anderson, CFA - Portfolio Manager
- Jonathan Strok, CFA - Portfolio Manager
- Michelle Beckler - Investment Analyst
- Samantha Reichert - Investment Analyst
Looking for help navigating your future?
Set up a meeting with your local rep to review your current policies and make sure they're up to date. We pulled together some less obvious reasons to adjust your coverage.
COUNTRY Financial® is a family of affiliated companies (collectively, COUNTRY) located in Bloomington, IL. Learn more about who we are.
NOT FDIC-INSURED
May lose value
No bank guarantee
All information is as of the report date unless otherwise noted.
This material is provided for informational purposes only and should not be used or construed as investment advice or a recommendation of any security, sector, or investment strategy. All views expressed and forward-looking information, including forecasts and estimates, are based on the information available at the time of writing, do not provide a complete analysis of every material fact, and may change based on market or other conditions. Statements of fact are from sources considered reliable, but no representation or warranty is made as to their completeness or accuracy. Unless otherwise noted, the analysis and opinions provided are those of the COUNTRY Trust Bank investment team identified above and not necessarily those of COUNTRY Trust Bank or its affiliates.
Diversification, asset allocation and rebalancing do not assure a profit or guarantee against loss. All market indexes are unmanaged, and returns do not include fees and expenses associated with investing in securities. It is not possible to invest directly in an index.
Investment management, retirement, trust and planning services provided by COUNTRY Trust Bank®.
Past performance does not guarantee future results. All investing involves risk, including risk of loss.
Definitions and Important Information
Figures 1,2,3,4,5,6: Data sourced from FactSet Research Systems Inc, a global provider of integrated financial information, analytical applications and services for the investment and corporate communities.
Figure 7: The long-term average return data comes from Morningstar and is based upon compound average annual returns for the period from 1996 through December 31, 2025. Stocks are represented by the S&P 500® Composite Index. Bonds are represented by the Bloomberg U.S. Aggregate Bond Index. Cash Equivalents are represented by the Bloomberg U.S. Treasury Bill 1–3-month Index. The “Balanced Portfolio” is representative of an investment of 50% stocks and 50% bonds rebalanced daily. Forecasted stock returns include small capitalization and international equities. Forecasted bond returns include investment-grade bonds as well as below investment-grade bonds. These returns are for illustrative purposes and not indicative of actual portfolio performance. It is not possible to invest directly in an index.
Stocks of small-capitalization companies involve substantial risk. These stocks historically have experienced greater price volatility than stocks of larger companies, and they may be expected to do so in the future.
International investing involves risks not typically associated with domestic investing, including risks of adverse currency fluctuations, potential political and economic instability, different accounting standards, limited liquidity, and volatile prices.
Fixed income securities are subject to various risks, including changes in interest rates, credit quality, market valuations, liquidity, prepayments, early redemption, corporate events, tax ramifications and other factors. Debt securities typically decrease in value when interest rates rise. The risk is usually greater for longer-term debt securities. Investments in lower-rated and nonrated securities present a greater risk of loss.
The yield curve plots the interest rates of similar-quality bonds against their maturities. The most common yield curve plots the yields of U.S. Treasury securities for various maturities. An inverted yield curve occurs when short-term rates are higher than long-term rates.
The S&P 500® Index is an unmanaged index consisting of 500 large cap U.S. stocks. The index does not reflect investment management fees; brokerage commission and other expenses associated with investing in equity securities.
The Bloomberg Aggregate Bond Index, often referred to as “the Agg,” is a broad-based benchmark that measures the performance of the U.S. investment-grade bond market. It includes a wide range of fixed-income securities.
The Bloomberg Galaxy Bitcoin Index represents the performance of Bitcoin as a digital asset, tracking changes in its market price across major crypto trading venues.
The gold New York Spot ($/oz) tracks the price of physical gold. It reflects how the market values gold as a store of wealth and a safe‑haven asset.
The International Emergency Economic Powers Act (IEEPA) provides the President broad authority to regulate a variety of economic transactions following the declaration of a national emergency. (Source)
The CME FedWatch tool analyzes the probabilities of changes to the fed funds rate and U.S. monetary policy as implied by 30-day Fed Funds futures pricing data.
The price-to-earnings ratio is a valuation ratio which compares a company's current share price with its earnings per share (EPS). EPS is usually from the last four quarters (trailing P/E), but sometimes it can be derived from the estimates of earnings expected in the next four quarters (projected or forward P/E). The ratio is also sometimes known as "price multiple" or "earnings multiple."
The federal funds rate is the interest rate at which depository institutions (like banks and credit unions) lend reserve balances to other depository institutions overnight on an uncollateralized basis. This rate is a key tool of U.S. monetary policy, set by the Federal Open Market Committee (FOMC) of the Federal Reserve. Changes in the federal funds rate can influence various economic factors, including inflation, employment, and the rates on consumer loans and mortgages.
Yield to Maturity (YTM) represents the total rate of return an investor can expect from a bond if they hold it until maturity and reinvest all interest payments at the same rate. It’s expressed as an annual percentage.
Credit spreads measure the difference in yields between bonds with the same maturity but different credit quality.
Standard deviation measures how spread out a series of data is from its average or mean. A higher standard deviation means a wider dispersion to the mean. Two standard deviations imply that 95% of data values fall within +/- 2 standard deviations assuming a normal bell-curve shape.