Market and Economic Outlook - Released 3/31/25
Key takeaways
- Heightened uncertainty for the economy and markets is likely to persist in the near term. Staying the course in your overall asset allocation is often the best course of action.
- While it has been lucrative to maintain meaningful exposure to growth sectors these last few years, quarters like this demonstrate the importance of diversification across a wide variety of economic sectors and avoiding over concentrating a portfolio around any sector or theme.
- Despite interest rate volatility, yields remain high relative to recent history, making them an attractive investment in our view.
During times of uncertainty, fearful headlines, and market gyrations it is easy to get lost on what success looks like in an investment portfolio. Sometimes seeing large daily moves in account values can mask the slow and steady compounding of wealth being built over multiple decades. A great case study of this, is the question: “If you start with a penny and double each day’s ending amount for 30 days, what is your ending balance?” We encourage you to produce your own answer, which we will share at the end.
It is often wise to remain focused on what you can control as an investor. We believe focusing on high quality companies trading at what we deem to be attractive valuations is the best way forward during times of economic uncertainty. Many of those companies are starting to look attractive to us today.
To navigate the uncertainties investors face, it can be helpful to take a step back, focus on goals, and create a plan to align portfolios with them. In this context, we feel it makes sense to be neutrally positioned between stocks and bonds, as we do not have the conviction to go overweight nor underweight in this environment. Diversification has worked well so far this year, providing a balanced approach to navigating market fluctuations.
The word of the day is…
…Uncertainty.
There has been no shortage of market moving headlines during the first quarter of this year. While January started off the year with most asset classes in the black and the S&P 500 hitting three new all-time closing highs through the middle of February, that momentum faded at the end of February and through March. From its February 19 closing high, the S&P 500 entered correction territory (a decline of 10% or more) on March 13 having dropped 10.1%. Fear in the markets, as measured by the CBOE Market Volatility Index (also known as the “fear gauge”), has climbed since the end of last year up to a level of 27.9 before coming back down to end the quarter at 22.3.
Uncertainty has been the theme of the year thus far and has sparked much of the gyrations we have seen. Tariff headlines came and went with new tariffs announced, changed, and delayed multiple times with the most recent being the auto tariff announcement. Markets in general crave certainty; however, the current geopolitical environment has been anything but. Consumer confidence has fallen with the Expectations Index component falling to a level last seen in 2013. Consumer spending has also slowed as pointed out by Federal Reserve Chair Jerome Powell whose Federal Open Market Committee (FOMC) elected to hold rates steady at the first two rate setting meetings of the year. Meanwhile, other data continues to hold up well such as those for the labor market with the unemployment rate at 4.1%, payroll growth averaging 138,000 jobs for the first two months of the year, and jobless claims averaging 223,500 over the past four weeks, which is just 12,000 more claims than a year ago.
It is important to look back to see how markets have moved historically and particularly to the downside. As shown below, the average intra-year drawdown for the S&P 500 Index going back to 2000 has been a 16% drop (Figure 1). In half of those years where the index saw a 10% or larger decline, the index ended with a positive return for the full year. Many times, market volatility becomes an opportunity for those willing to stay the course. And while we remain neutral on stock and bond allocations, we will continue to look for dislocations in the market where we can take advantage.
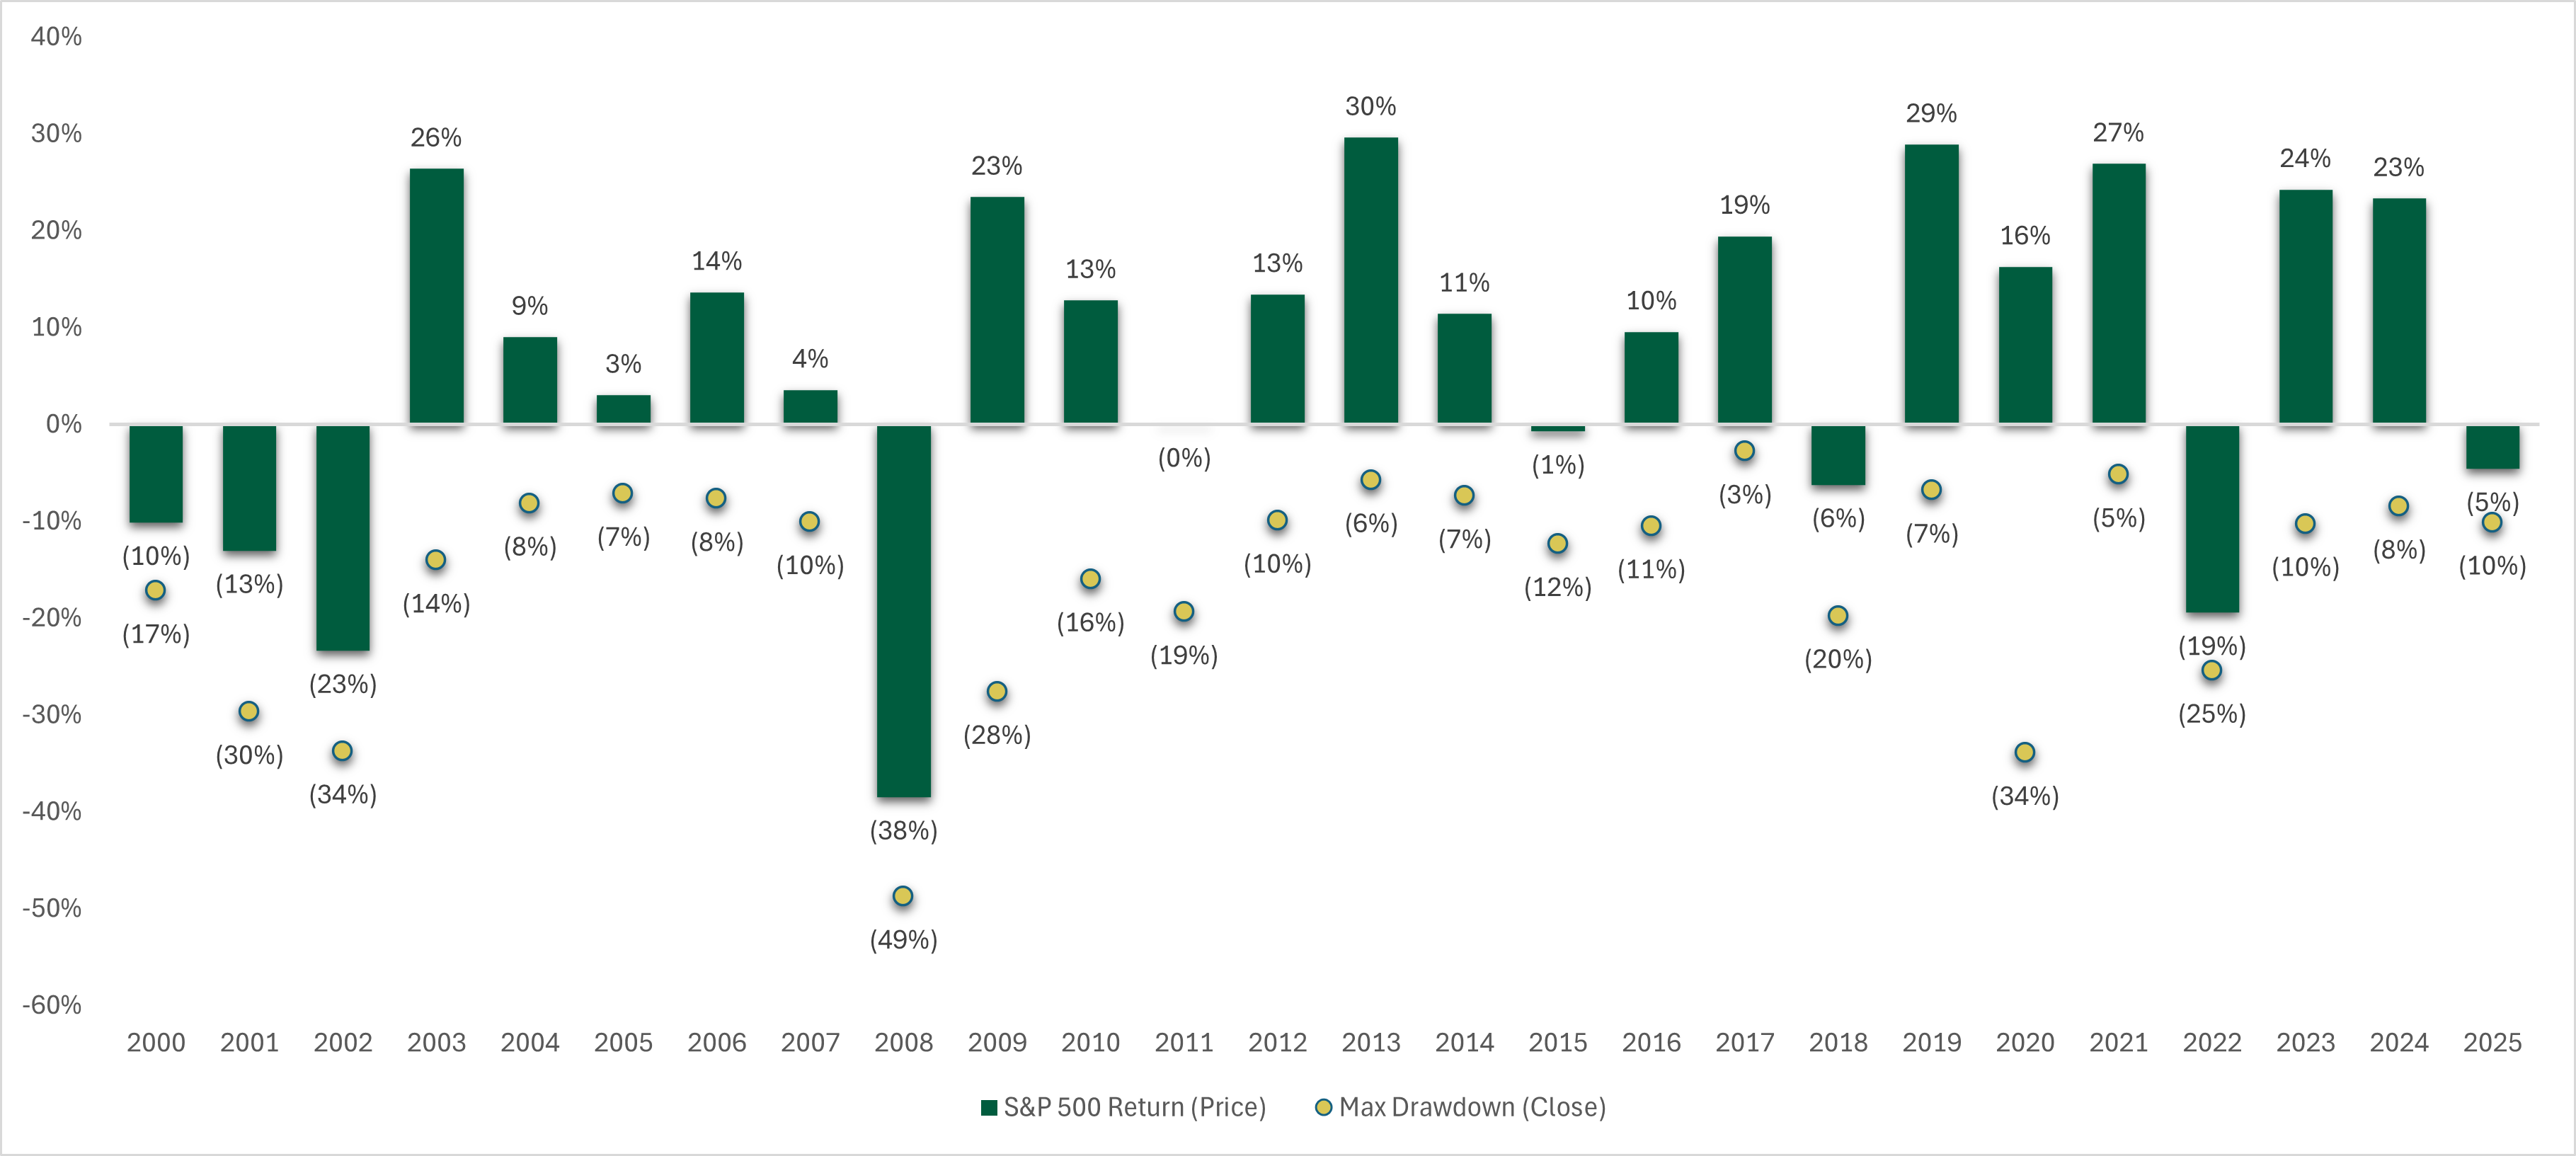 Figure 1
Despite U.S. stock markets having a tough start to the year, international markets and bonds have provided much needed diversification. International developed markets are up 7% year-to-date, while emerging market stocks are up about 3%. Bonds, both high-quality, investment grade as well as high yield, provided positive returns for the first quarter as well (Figure 2).

Economic and geopolitical uncertainty is not likely to go away any time soon. Markets are likely to continue to give us more ups and downs to contend with. In these uncertain times, staying the course is typically the best course of action. Having a solid plan in place can help you weather these storms. Let’s dive further into the stock and bond markets to look at what is driving those asset classes and how we are positioned.
Not all was lost
Despite a correction of over 10% from its intra-year highs, the S&P 500 finished down a modest –4.3% from the end of 2024. Interestingly, only four out of the 11 major economic sectors had negative returns in the first quarter (Figure 3). Among these four negative performing sectors included the information technology, communication services, and consumer discretionary sectors. These three sectors collectively make up nearly 50% of the entire benchmark’s total weight. This significant weight demonstrates the dominance these sectors have on the benchmark and overall market sentiment, which ultimately led to negative returns for the S&P 500 during the quarter. These sectors have been some of the strongest performers in recent years, making the first quarter a reversal in some ways. While it has been lucrative to maintain meaningful exposure to these sectors the last few years, quarters like this demonstrate the importance of diversification across a wide variety of economic sectors and avoiding over concentrating a portfolio positioned around any particular sector or theme.
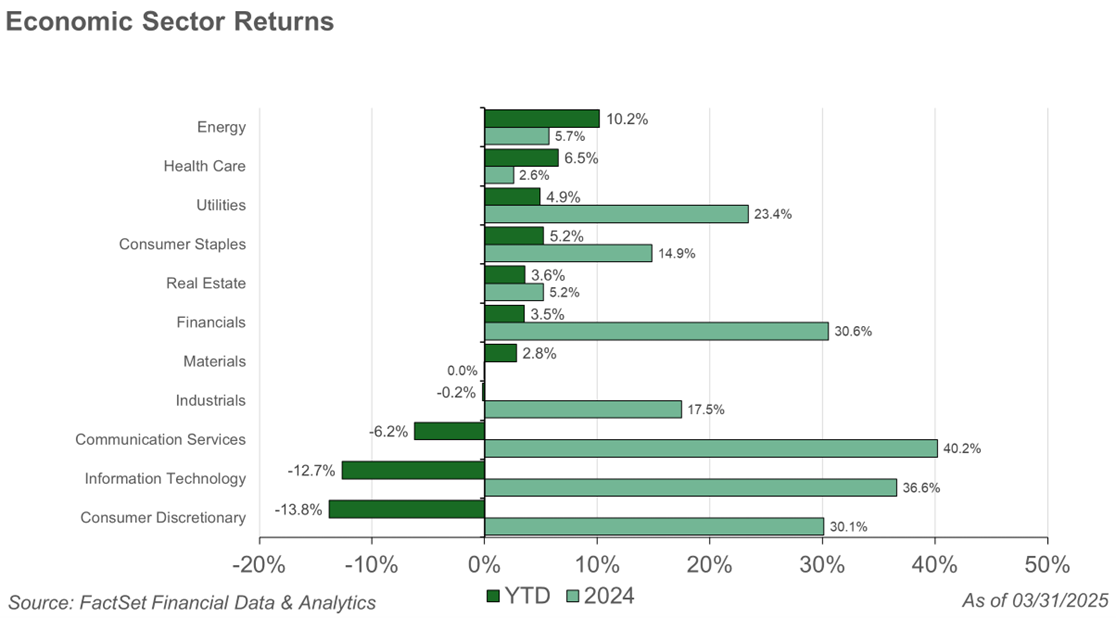 Figure 3
We commented last quarter about elevated valuations in the S&P 500 possibly leading to slower average returns going forward. With the recent pullbacks, valuations have improved but remain elevated relative to historical levels. As we look under the surface, we are starting to see pockets of opportunity to own high quality companies, at more favorable valuations than at the start of the year. We will continue to evaluate company fundamentals, looking for strong projected growth at attractive valuations.
International strength
While much of the uncertainty and risks we have written about in previous years related to international stocks and a stronger U.S. dollar, we believe the tide has shifted some towards more uncertainty that exists related to the U.S. policy dynamics and economic outlook in the U.S., which we believe has contributed to international stocks outperforming to start the year. Despite underperforming U.S. large cap peers in 2024 by nearly 20%, international stocks are now performing very close to U.S. large cap stocks over the last 12 months as the U.S. dollar strength has moderated (Figure 4). We continue to maintain a neutral stance on international stocks, but believe they have a persistent fit in a diversified portfolio. We maintain a slight preference towards developed market stocks within international relative to emerging markets.
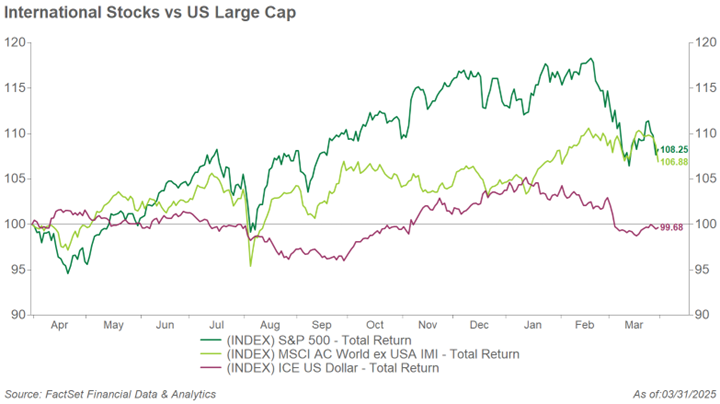 Figure 4
Small and mid-cap stocks faced their own share of volatility during the quarter, underperforming even U.S. large cap stocks. We continue to maintain a neutral stance between market capitalizations within the United States.
Interest rate seesaw
Interest rates during the quarter were influenced by factors such as deficits, trade wars, and possible tax cuts, all of which could contribute to inflationary pressures. However, concerns about a weakening economy created a push-and-pull dynamic between inflation fears and recession risk.
Looking ahead, we expect bond interest rates to remain range bound. Persistent inflation could lead to higher yields and negatively impact bond returns. Conversely, signs of economic weakness may drive investors toward high-quality bonds like Treasuries, supporting bond prices. If interest rates remain near current levels, bond returns are likely to come primarily from coupon income rather than price appreciation.
Current economic conditions may prompt the Federal Reserve to adjust its rate policy, though the timing remains uncertain, as market expectations for Fed actions have often been inaccurate. However, we believe the Fed could act swiftly if economic weakness comes to fruition. Despite interest rate volatility, yields remain high relative to recent history, making them an attractive investment in our view. Bonds also provide valuable diversification, helping cushion stock market losses, as demonstrated during the quarter.
Playing the spread
A credit yield spread is the extra return for taking on higher default risk compared to safer debt. Despite economic uncertainty, credit yield spreads on corporate bonds remain low (Figure 5). If economic conditions worsen, investors might seek safer options, causing credit spreads to widen and bond prices to decline. Bondholders benefit from these higher yields if they hold the bond to maturity without default. Low spreads suggest lower perceived default risk, but investors must assess if the risk is worth it. High-quality bonds are preferred due to insufficient risk compensation in our view but still allocate moderately to below-investment-grade bonds for yield and diversification.
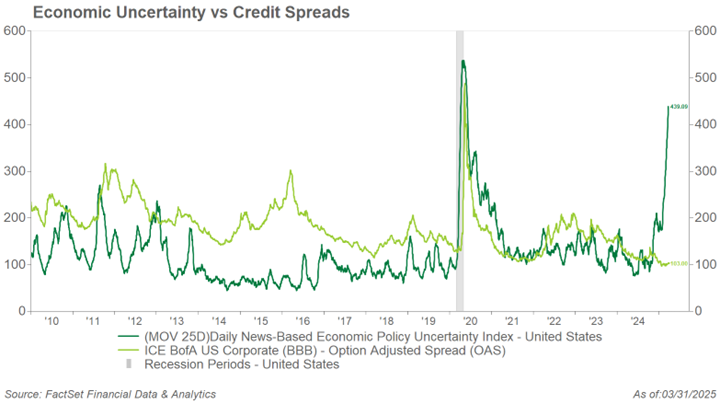 Figure 5
The bottom line
The answer to our case study is $5,368,709.12 (Figure 6). If you guessed much less, you are not alone; many people we have polled over the years have done the same. Compounding takes time and patience. In fact, in our example, you do not reach over $1 million until day 28! It is hard to see the ultimate success of investment outcomes occurring over the short term, as it is gradual by nature. By maintaining a balanced approach and diversifying investments, we feel one can navigate recent market volatility more effectively. In an ever-changing financial landscape, it is crucial to stay informed, remain patient, and resist the temptation to react impulsively to short-term market fluctuations and the news that drives them.
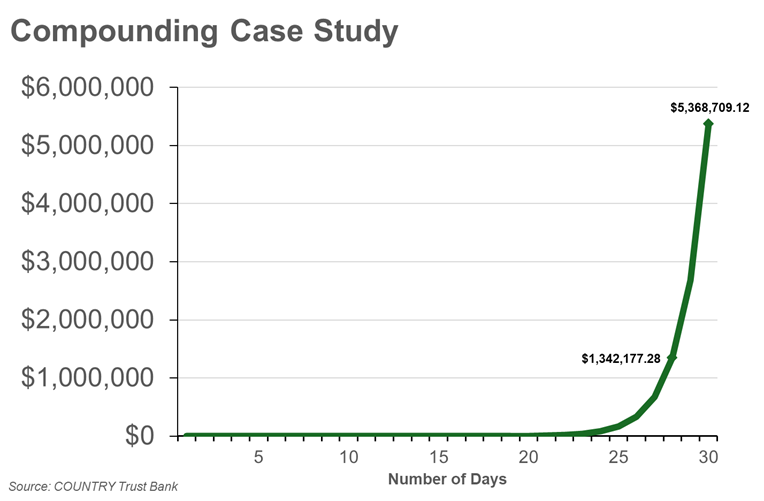 Figure 6
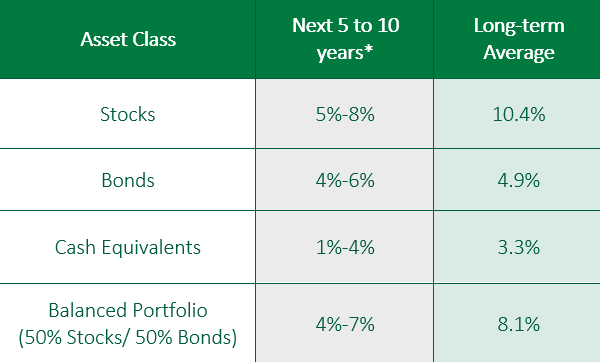 Figure 7
*Forecasted average annual returns of COUNTRY Trust Bank Wealth Management
Source: Morningstar and COUNTRY Trust Bank® - See Definitions and Important Information below
COUNTRY Trust Bank® Wealth Management Team
- Troy Frerichs, CFA - VP, Investment Services
- Jeff Hank, CFA, CFP® - Manager, Wealth Management
- G. Ryan Hypke, CFA, CFP® - Portfolio Manager
- Beau Lartz, ChFC® - Investment Analyst
- Cody Behrens, ChFC® - Investment Analyst
- Emily Meldrum - Investment Analyst
- Chelsie Moore, CFA, CFP® - Director, Wealth Management & Financial Planning
- Kent Anderson, CFA - Portfolio Manager
- Jonathan Strok, CFA - Portfolio Manager
- Michelle Beckler - Investment Analyst
- Samantha Reichert - Investment Analyst
Looking for help navigating your future?
Set up a meeting with your local rep to review your current policies and make sure they're up to date. We pulled together some less obvious reasons to adjust your coverage.
COUNTRY Financial® is a family of affiliated companies (collectively, COUNTRY) located in Bloomington, IL. Learn more about who we are.
NOT FDIC-INSURED
May lose value
No bank guarantee
All information is as of the report date unless otherwise noted.
This material is provided for informational purposes only and should not be used or construed as investment advice or a recommendation of any security, sector, or investment strategy. All views expressed and forward-looking information, including forecasts and estimates, are based on the information available at the time of writing, do not provide a complete analysis of every material fact, and may change based on market or other conditions. Statements of fact are from sources considered reliable, but no representation or warranty is made as to their completeness or accuracy. Unless otherwise noted, the analysis and opinions provided are those of the COUNTRY Trust Bank investment team identified above and not necessarily those of COUNTRY Trust Bank or its affiliates.
Diversification, asset allocation and rebalancing do not assure a profit or guarantee against loss. All market indexes are unmanaged, and returns do not include fees and expenses associated with investing in securities. It is not possible to invest directly in an index.
Investment management, retirement, trust and planning services provided by COUNTRY Trust Bank®.
Past performance does not guarantee future results. All investing involves risk, including risk of loss.
Definitions and Important Information
Figures 1, 2, 3, 4, 5: Data sourced from FactSet Research Systems Inc, a global provider of integrated financial information, analytical applications and services for the investment and corporate communities.
Figures 6: COUNTRY Trust Bank proprietary research and analysis.
Figure 7: The long-term average return data comes from Morningstar and is based upon compound average annual returns for the period from 1926 through December 31, 2024. Stocks are represented by the Ibbotson® Large Company Stock Index, which is comprised of the S&P 500® Composite Index from 1957 to present, and the S&P 90® Index from 1926 to 1956. Bonds are represented by the Ibbotson® U.S. Intermediate-Term Government Bond Index. Cash Equivalents are represented by the 30-day U.S. Treasury bill. The “Balanced Portfolio” is representative of an investment of 50% stocks and 50% bonds rebalanced annually. Forecasted stock returns include small capitalization and international equities. Forecasted bond returns include investment grade corporate bonds. These returns are for illustrative purposes and not indicative of actual portfolio performance. It is not possible to invest directly in an index.
Stocks of small-capitalization companies involve substantial risk. These stocks historically have experienced greater price volatility than stocks of larger companies, and they may be expected to do so in the future.
International investing involves risks not typically associated with domestic investing, including risks of adverse currency fluctuations, potential political and economic instability, different accounting standards, limited liquidity, and volatile prices.
Fixed income securities are subject to various risks, including changes in interest rates, credit quality, market valuations, liquidity, prepayments, early redemption, corporate events, tax ramifications and other factors. Debt securities typically decrease in value when interest rates rise. The risk is usually greater for longer-term debt securities. Investments in lower-rated and nonrated securities present a greater risk of loss.
The S&P 500® Index is an unmanaged index consisting of 500 large-cap U.S. stocks. The index does not reflect investment management fees, brokerage commission and other expenses associated with investing in equity securities.
The S&P Midcap 400 is a stock market index published by Standard & Poor’s (S&P). It measures the performance of 400 mid-sized companies in the United States, providing a benchmark for this segment of the market. These companies typically have market capitalizations ranging from about $2 billion to $10 billion.
The MSCI EAFE Index measures international equity performance. It comprises the MSCI country indexes capturing large and mid-cap equities across developed markets in Europe, Australasia, and the Far East, excluding the U.S. and Canada.
The Russell 2000® Index measures the performance of the small-cap segment of the U.S. equity universe. It includes approximately 2000 of the smallest securities based on a combination of their market cap and current index membership.
The Bloomberg Aggregate Bond Index, often referred to as “the Agg,” is a broad-based benchmark that measures the performance of the U.S. investment-grade bond market. It includes a wide range of fixed-income securities.
The MSCI ACWI ex USA IMI Index (MSCI All Country World Index excluding USA Investable Market Index) is designed to measure the performance of large, mid, and small-cap stocks across 22 of 23 developed markets (excluding the United States) and 24 emerging markets. This index covers approximately 99% of the global equity opportunity set outside the U.S.
Non-farm payrolls are collected by the U.S. Bureau of Labor Statistics (BLS) monthly through the establishment survey which provides information on employment, hours, and earnings of employees on non-farm payrolls.
The CBOE Volatility Index (VIX), often referred to as the “fear index,” is a real-time market index that represents the market’s expectations for volatility over the coming 30 days.
GDP or Gross Domestic Product is the monetary value of all goods and services produced during a specified period. The figure is used as a barometer of an economy’s health including its size and growth rate. In the U.S., quarterly GDP figures are typically “annualized” meaning the quarterly growth is compounded for four quarters.
The price-to-earnings ratio is a valuation ratio which compares a company's current share price with its earnings per share (EPS). EPS is usually from the last four quarters (trailing P/E), but sometimes it can be derived from the estimates of earnings expected in the next four quarters (projected or forward P/E). The ratio is also sometimes known as "price multiple" or "earnings multiple."
The yield curve plots the interest rates of similar-quality bonds against their maturities. The most common yield curve plots the yields of U.S. Treasury securities for various maturities. An inverted yield curve occurs when short-term rates are higher than long-term rates.
The federal funds rate is the interest rate at which depository institutions (like banks and credit unions) lend reserve balances to other depository institutions overnight on an uncollateralized basis. This rate is a key tool of U.S. monetary policy, set by the Federal Open Market Committee (FOMC) of the Federal Reserve. Changes in the federal funds rate can influence various economic factors, including inflation, employment, and the rates on consumer loans and mortgages.
Yield to Maturity (YTM) represents the total rate of return an investor can expect from a bond if they hold it until maturity and reinvest all interest payments at the same rate. It’s expressed as an annual percentage.
Credit spreads measure the difference in yields between bonds with the same maturity but different credit quality.