Market and Economic Outlook - Released 3/31/24
Key Takeaways:
- With bond yields still at healthy levels we prefer to capture a more attractive equity risk premium before shifting back to a neutral or overweight position in equities for multi-asset portfolios.
- In markets where returns have recently been driven by a narrow group of stocks of the largest companies in the world, we encourage investors to not lose sight of the benefits of diversification.
- Higher bond yields are more capable of offsetting interest rate increases. However, if an unforeseen event causes investors to become more cautious, spread widening is a risk to bond market returns.
The expression "Make hay while the sun shines" dates to medieval times and refers to farmers needing to cut their hay during dry conditions or moisture would ruin the crop. This age-old idiom could apply to today’s investing climate as the sun has certainly been shining on client portfolios. The frenzy surrounding artificial intelligence leading to productivity gains, resilient consumer spending, and anticipated Federal Reserve policy changes has propelled the S&P 500 to multiple record highs this year. As long-term investors, we know it can feel good to soak in the rays of favorable market conditions and reap the rewards of higher account values; however, we also need to be prepared for any storm clouds that could be approaching.
While global equity markets have rallied, we continue to marginally favor fixed income relative to equities in multi-asset portfolios. When evaluating the opportunities between fixed income and equities, one measure of valuation we consider is the equity risk premium. This refers to the excess return that investing in the stock market is expected over time relative to U.S. Treasury bonds (also considered the risk-free rate). This excess return compensates investors for taking on the higher risk of equity investing, and this measure remains low today relative to history.
Given that bond yields are still at healthy levels, we prefer to capture a more attractive equity risk premium before shifting back to a neutral or overweight position in equities in multi-asset portfolios. It is important to emphasize that we reflect this view within the guardrails of an appropriate investment objective. Each client’s financial goals are unique, and we recommend investors prioritize their individual risk objective when considering these perspectives to ensure alignment with their long-term goals.
Broad rally in stocks
The first quarter of 2024 has continued on the strong note that closed out 2023. It has now been five consecutive months of growth for the S&P 500 index and five straight months of growth for the MSCI EAFE international developed index. Small company stocks took a breather in January from the torrid pace they were on to end 2023, and four of the last five months have been positive for the asset class. While the Russell 2000 lags the S&P 500 year-to-date, the two are neck and neck over the last five months with international stocks not far behind. On the other hand, bond prices lagged to start the year with interest rates rising. This reversed some of the rally we saw in bond prices at the end of 2023. Bond prices have an inverse relationship to interest rates, and move down when interest rates rise and vice versa.
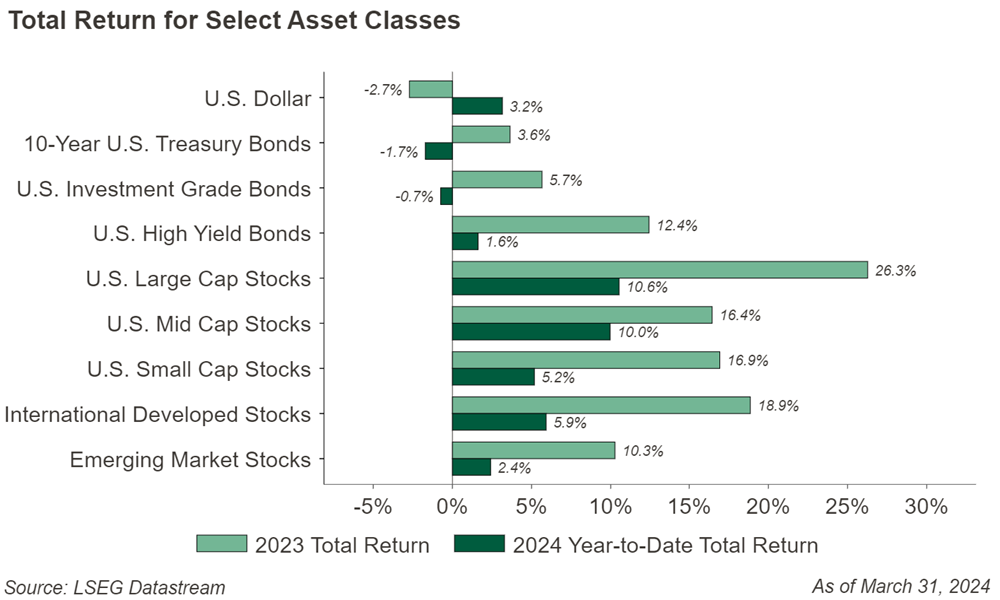 Figure 1
Turning to the economy, the consumer continues to be relatively healthy. Incomes have held up with average hourly earnings (AHE) growth outpacing that of the Consumer Price Index (CPI) since the middle of 2023 (Figure 2). This has helped consumers to continue spending. Retail sales dipped 1.1% in January after the holiday season and bounced back in February increasing 0.6%.
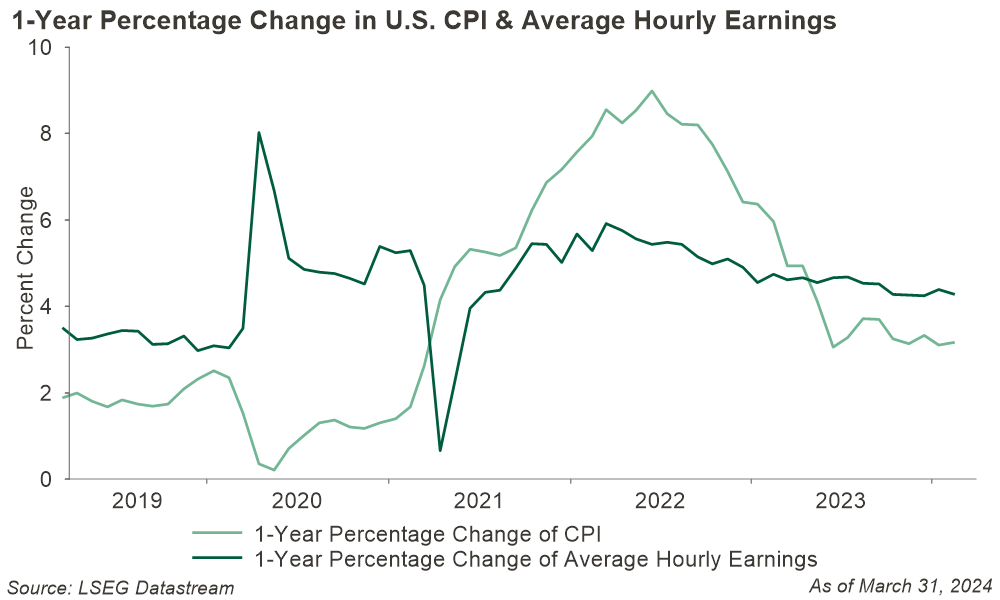 Figure 2
The labor market continues to hold up as well. January and February saw 229,000 and 275,000 non-farm jobs added into the economy, respectively, with the last 12-months averaging 229,000 new jobs. Jobless claims remain at low levels with companies continuing to hold on to workers, and we see continued worker demand outpacing supply. While the dynamic between worker supply and demand has come more into balance recently, it should continue to aid in the resiliency of consumer spending (Figure 3).
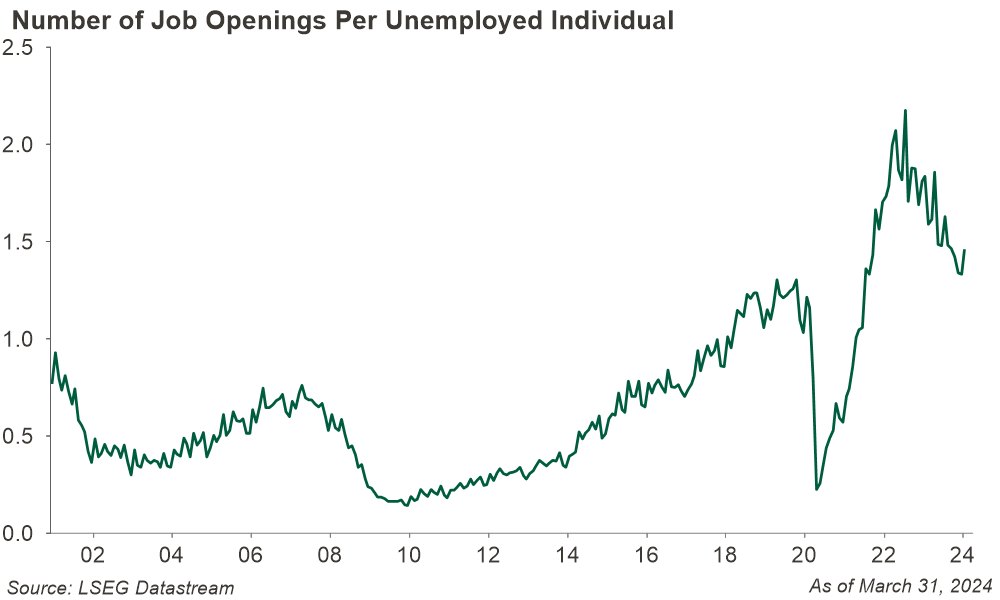 Figure 3
Don’t abandon diversification
The S&P 500 carried on its momentum from 2023 into the first quarter by returning over 10%. Looking further down the market capitalization(cap) spectrum to small and mid-size companies (SMID), returns were positive, but did not match their large cap peers. In markets where returns have recently been driven by a narrow group of stocks of the largest companies in the world, we encourage investors to not lose sight of the benefits of diversification. With rising stock prices, we have seen expanding price to earnings (P.E.) ratios in U.S. large cap stocks, which we think represents the growing optimism of investors that we will see continued economic strength. In this backdrop, we also see the risk that elevated valuations could lead to muted upside, as we observe trends that starting P.E. ratios correlate highly with future return prospects (Figure 4).
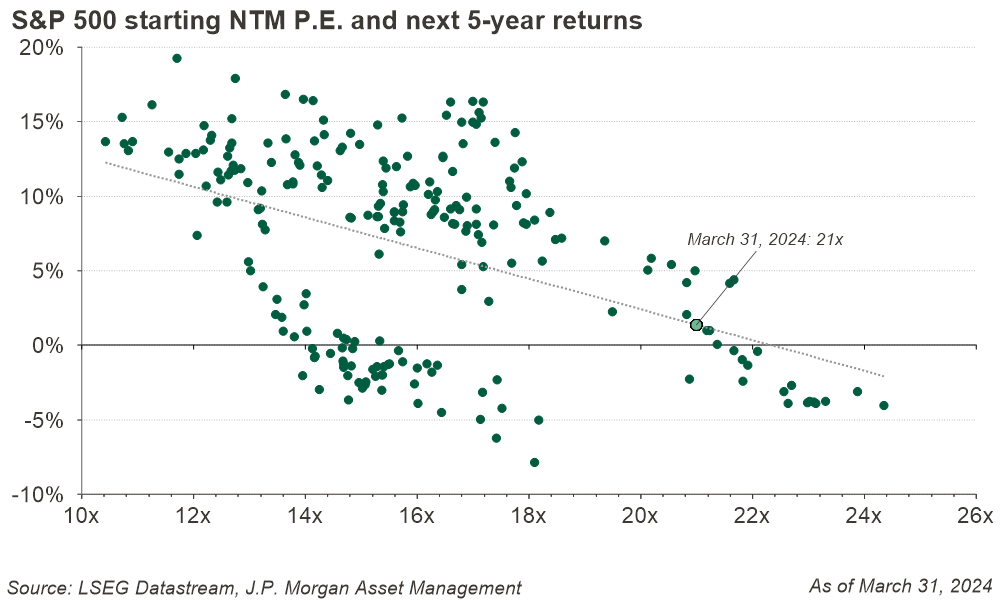 Figure 4
While SMID-cap stocks have participated in the rally to start the year, their valuations still look more attractive relative to large cap. We also see a scenario where SMID-cap stocks benefit from a decline in the level of interest rates. When the 10-year U.S. Treasury Bond yield hit its recent peak in mid-October 2023 through the end of the first quarter 2024, both groups performed in line with or outperformed their large cap peers when the yield pulled back from its highs. This has us constructive on the possibility that we will see a wider breadth of market returns in a scenario where interest rates are falling (Figure 5). For these reasons we currently maintain a slight preference towards SMID-cap companies relative to their large cap peers.
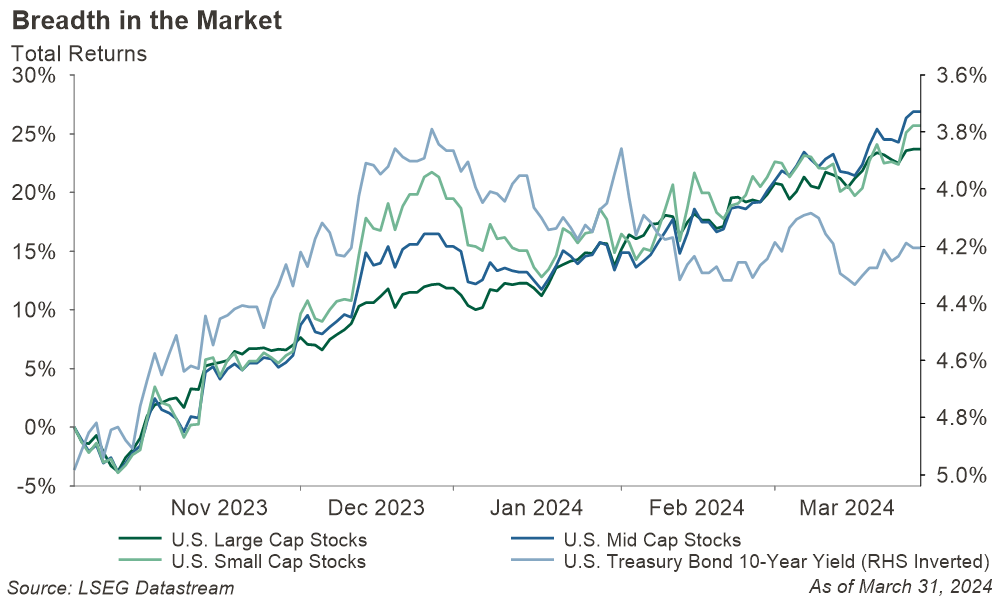 Figure 5
Cautious on China and Bitcoin
We believe a diversified portfolio also includes an appropriate allocation to international stocks in both developed and emerging markets. Recently we have become more cautious on emerging markets and currently favor developed markets relative to emerging markets within international allocations. We particularly see risks in the investment opportunity within China, which dominates the emerging market investable universe from a percentage of market capitalization basis.
January of 2024 marked the SEC’s approval of the first spot price Bitcoin exchange traded funds (ETFs). This followed with billions of dollars flowing into the new ETFs and a strong rally in Bitcoin’s spot price. While the approval of Bitcoin ETFs makes investing in Bitcoin more accessible to investors, we remain on the sidelines opting not to allocate to this emerging asset class in diversified portfolios. Despite strong returns over the last 15 months, we continue to have concerns around limited methods to estimate its intrinsic value, the liquidity & security profile of the underlying asset, and we still maintain a preference for cash flow generating assets like stocks and bonds. Additionally, we observe that Bitcoin price movements have historically demonstrated far greater volatility, including 3x that of U.S. Small cap stocks measured by the Russell 2000 Index, versus the equity asset classes we have discussed above (Figure 6).
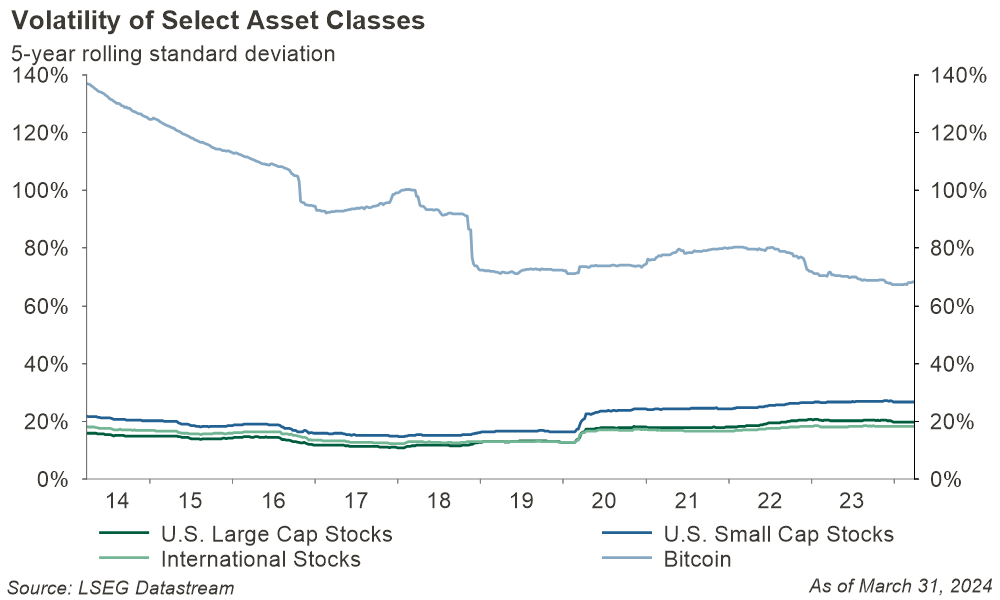 Figure 6
Bond Yields Bounce
The first quarter saw upward pressure on Treasury yields as inflation remains resilient (Figure 7).
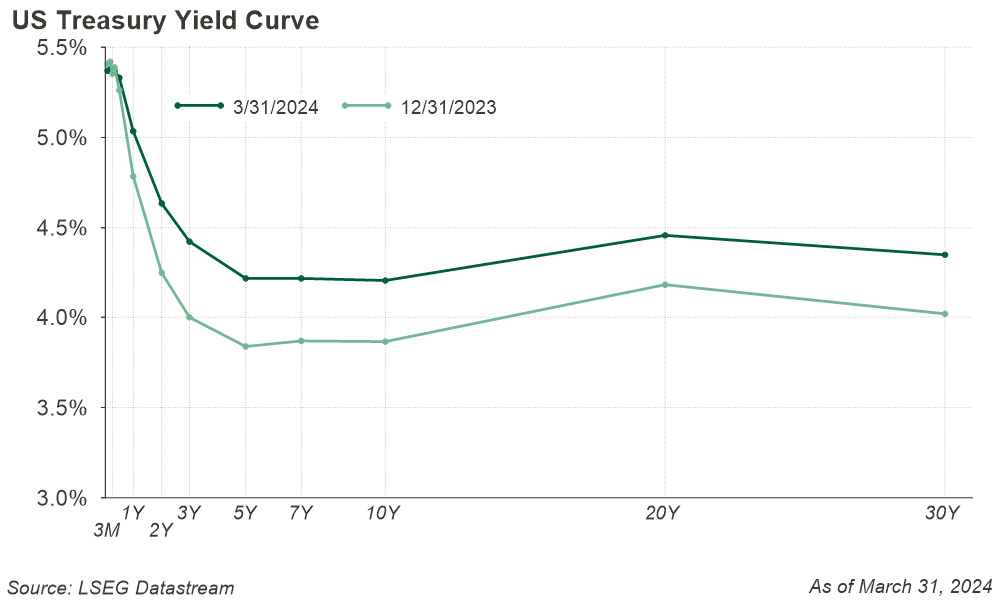 Figure 7
Bond investors are trying to determine when and how much the Federal Reserve will reduce interest rates during the year. Inflation data, exceeding the Fed’s target, has led to delayed expectations of rate cuts with the possibility of interest rates staying higher for longer than previously forecasted.
Bond values usually move in the opposite direction of interest rates. When interest rates rise, prices of existing bonds usually fall as these bonds become less attractive in the marketplace. We believe investment grade bond yields remain attractive today. Investors can earn the high coupons paid by new issue bonds. Lower coupon bonds, issued when rates were lower, trade at significant discounts to par, providing attractive total return opportunities. Falling yields could lead to price appreciation in addition to the income earned on the bonds.
Whether the Fed ends up cutting in June or later, the prospect for lower short-term rates remains high as the year progresses. If short-term interest rates are set to decrease, the Treasury yield curve could steepen and return to a more normalized shape with longer rates higher than shorter rates. We feel it makes sense for fixed income investors to secure longer-dated cash flows found within intermediate and long-duration fixed income. We are positioning client portfolios to have a neutral duration in line with the U.S. investment grade bond market.
Treasury bond market volatility could persist amid increased Treasury supply. Deficit spending, national debt levels, and debt ceiling drama are some of the potential risks that could lead to further Treasury bond market volatility.
Compensated for Credit Risk?
Bonds are attractive due to high interest rates but do not provide much compensation to investors for taking on credit risk. Credit spreads, or the difference in the yield of two bonds with the same maturity, remain compressed relative to historical averages. However, corporate credit fundamentals remain supportive due to strength of the U.S. economy.
Higher bond yields are more capable of offsetting interest rate increases. However, if an unforeseen event causes investors to become more cautious, spread widening is a risk to bond market returns. We feel it is prudent to favor high quality bonds with some exposure to floating rate bank loans, preferred stock, and emerging markets debt for diversification.
The Bottom Line
Today, the investing climate is ideal with rising prices for risk assets like stocks and more conservative investors able to earn competitive yields on safer alternatives like fixed income. Given the rally, valuations on stocks give us pause in favor of the relative attractiveness of bonds. While we would much prefer our clients to experience those sunny days, we know it is hard to predict when clouds will emerge. A well-planned, diversified portfolio protects investors from potential storms which may come their way.
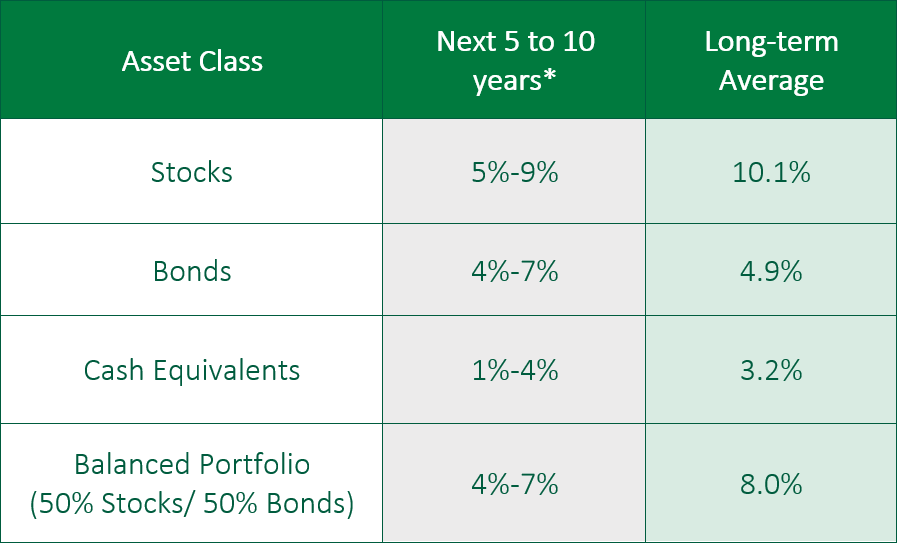 Figure 7
*Forecasted average annual returns of COUNTRY Trust Bank Wealth Management
Source: Morningstar and COUNTRY Trust Bank® - See Definitions and Important Information below
COUNTRY Trust Bank® Wealth Management Team
- Troy Frerichs, CFA - VP, Investment Services
- Jeff Hank, CFA, CFP® - Manager, Wealth Management
- G. Ryan Hypke, CFA, CFP® - Portfolio Manager
- Beau Lartz, ChFC® - Investment Analyst
- Cody Behrens, ChFC® - Investment Analyst
- Emily Meldrum - Investment Analyst
- Chelsie Moore, CFA, CFP® - Director, Wealth Management & Financial Planning
- Kent Anderson, CFA - Portfolio Manager
- Jonathan Strok, CFA - Portfolio Manager
- Michelle Beckler - Investment Analyst
- Samantha Reichert - Investment Analyst
Looking for help navigating your future?
Set up a meeting with your local rep to review your current policies and make sure they're up to date. We pulled together some less obvious reasons to adjust your coverage.
COUNTRY Financial® is a family of affiliated companies (collectively, COUNTRY) located in Bloomington, IL. Learn more about who we are.
NOT FDIC-INSURED
May lose value
No bank guarantee
Investment management, retirement, trust and planning services provided by COUNTRY Trust Bank®.
Past performance does not guarantee future results. All investing involves risk, including risk of loss.
All information is as of the report date, unless otherwise noted.
This material is provided for informational purposes only and should not be used or construed as investment advice or a recommendation of any security, sector, or investment strategy. All views expressed and forward-looking information, including forecasts and estimates, are based on the information available at the time of writing, do not provide a complete analysis of every material fact, and may change based on market or other conditions. Statements of fact are from sources considered reliable, but no representation or warranty is made as to their completeness or accuracy. Unless otherwise noted, the analysis and opinions provided are those of the COUNTRY Trust Bank investment team identified above and not necessarily those of COUNTRY Trust Bank or its affiliates.
Diversification, asset allocation and rebalancing do not assure a profit or guarantee against loss. All market indexes are unmanaged, and returns do not include fees and expenses associated with investing in securities. It is not possible to invest directly in an index.
Definitions and Important Information
Figures 1-7: Chart data comes from LSEG DataStream, a powerful platform that integrates top-down macroeconomic research and bottom-up fundamental analysis.
Figure 4: Reflects the S&P 500 weighted average next 12-month forward PE ratio and go forward rolling annualized 60-month future returns since 12/31/1999. March 31,2024 P.E. ratio extrapolated onto the trend line for visual purposes. Data calculated independently by COUNTRY Trust Bank using LSEG DataStream. Study influenced from J.P Morgan Asset Management: P/E ratios and equity returns (March 31, 2024) J.P. Morgan Guide to the Markets. Available on slide 6: JPM Guide to the Market (Accessed: 01 April 2024).
Figure 5: Benchmarks: Large Cap-S&P 500, Mid Cap-S&P Midcap, Small Caps-Russell 2000
Figure 6: Reflects the annualized 5-year rolling standard deviation of weekly price changes. Benchmarks: Large Cap-S&P 500 TR, Small Caps- Russell 2000 TR, International-MSCI ACWI ex US NR USD, Bitcoin-USD to Bitcoin (Bitstamp)
Figure 8: The long-term average return data comes from Morningstar and is based upon compound average annual returns for the period from 1926 through December 31, 2023. Stocks are represented by the Ibbotson® Large Company Stock Index, which is comprised of the S&P 500® Composite Index from 1957 to present, and the S&P 90® Index from 1926 to 1956. Bonds are represented by the Ibbotson® U.S. Intermediate-Term Government Bond Index. Cash Equivalents are represented by the 30-day U.S. Treasury bill. The “Balanced Portfolio” is representative of an investment of 50% stocks and 50% bonds rebalanced annually. Forecasted stock returns include small capitalization and international equities. Forecasted bond returns include investment grade corporate bonds. These returns are for illustrative purposes and not indicative of actual portfolio performance. It is not possible to invest directly in an index.
Stocks of small-capitalization companies involve substantial risk. These stocks historically have experienced greater price volatility than stocks of larger companies, and they may be expected to do so in the future.
International investing involves risks not typically associated with domestic investing, including risks of adverse currency fluctuations, potential political and economic instability, different accounting standards, limited liquidity, and volatile prices.
Fixed income securities are subject to various risks, including changes in interest rates, credit quality, market valuations, liquidity, prepayments, early redemption, corporate events, tax ramifications and other factors. Debt securities typically decrease in value when interest rates rise. The risk is usually greater for longer-term debt securities. Investments in lower-rated and nonrated securities present a greater risk of loss to principal and interest than higher- rated securities.
The price-to-earnings ratio is a valuation ratio which compares a company's current share price with its earnings per share (EPS). EPS is usually from the last four quarters (trailing P/E), but sometimes it can be derived from the estimates of earnings expected in the next four quarters (projected or forward P/E). The ratio is also sometimes known as "price multiple" or "earnings multiple."
The yield curve plots the interest rates of similar-quality bonds against their maturities. The most common yield curve plots the yields of U.S. Treasury securities for various maturities. An inverted yield curve occurs when short-term rates are higher than long-term rates.
Credit spreads measure the difference in yields between bonds with the same maturity but different credit quality.
The Consumer Price Index (CPI) is a measure of the average change over time in the prices paid by urban consumers for a market basket of consumer goods and services. Indexes are available for the U.S. and various geographic areas.
The S&P 500® Index is an unmanaged index consisting of 500 large-cap U.S. stocks. Since it includes a significant portion of the total value of the market, it also considered representative of the market. The index does not reflect investment management fees, brokerage commission and other expenses associated with investing in equity securities.
The MSCI ACWI ex USA Index represents large and mid-cap companies across 22 of 23 developed markets – excluding the United States – and 24 emerging markets. The index covers approximately 85% of the global equity opportunity set outside the United States and has over 1,800 constituents.
The MSCI EAFE Index is broadly recognized as the pre-eminent benchmark for U.S. investors to measure international equity performance. It comprises the MSCI country indexes capturing large and mid-cap equities across developed markets in Europe, Australasia, and the Far East, excluding the U.S. and Canada.
The Russell 2000® Index measures the performance of the small-cap segment of the U.S. equity universe. The Russell 2000 Index is a subset of the Russell 3000® Index representing approximately 10% of the total market capitalization of that index. It includes approximately 2000 of the smallest securities based on a combination of their market cap and current index membership.