Market and Economic Outlook - Released 9/30/26
Key takeaways
· Given current market conditions, we believe a neutral allocation between stocks and bonds for multi-asset portfolios is appropriate.
· While we remain constructive on stocks overall, we continually strive to balance risk and opportunity across the investable universe.
· Higher long-term interest rates have challenged markets but improved the attractiveness of high-quality bonds by offering stronger income and return potential.
For much of the past decade, investing appeared relatively straightforward. Stocks delivered returns well above their long-term averages, while bond returns struggled to keep pace with inflation. Investors were rewarded for taking additional risk, while traditional fixed income played a limited role in portfolio returns.
One of the challenges in financial markets is the tendency to look in the rearview mirror when making allocation decisions. Strong past performance often shapes expectations for the future, even when market conditions have changed. Today, higher Treasury bond yields have restored the income-generating power of investment-grade bonds, creating opportunities to earn returns above inflation without relying exclusively on stock market appreciation.
The U.S. stock market continues to be supported by a resilient economy and the transformative potential of artificial intelligence (AI). Businesses are investing heavily in AI-related technologies, consumer spending remains healthy, and the labor market is stable. We believe AI-driven innovation may still be in the initial stages of delivering productivity gains that support economic growth and corporate earnings for years to come.
However, investors must weigh these opportunities against several important risks. Persistent fiscal deficits and ongoing geopolitical tensions have increased inflationary pressures. Rising energy prices are a key concern, as higher fuel and transportation costs often ripple through the broader economy, leading to more persistent and widespread inflation over time.
Given current market conditions, we believe a neutral allocation between stocks and bonds for multi-asset portfolios is appropriate. Elevated bond yields have created a more balanced opportunity set across asset classes, allowing investors to participate in the long-term growth potential of equities while benefiting from the attractive income available in high-quality bonds.
A solid economic backdrop. Inflation still lingers.
The third quarter of the year delivered mixed results. The S&P 500 Index rose 2.3% in the quarter, driven by strong earnings growth, while smaller companies posted their first negative quarter of the year. For the full year, stocks across the board have been resilient, powering through headlines involving geopolitics, oil prices, inflation, and higher-for-longer interest rates, among other developments. Bonds, on the other hand, could experience their first year of negative returns since 2022, although current yield levels provide a stronger backdrop for future performance (Figure 1).
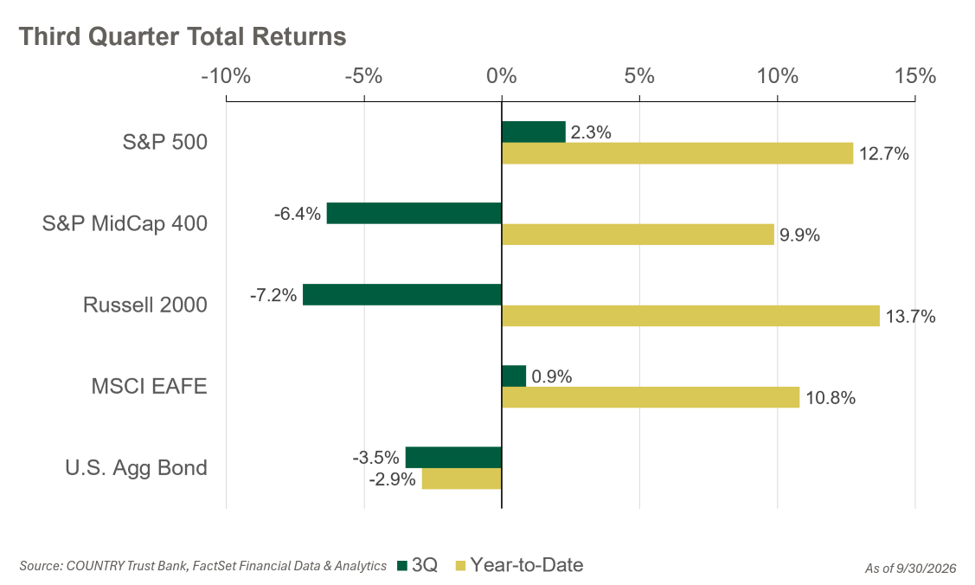 Figure 1
Interest rates continued their march higher over the course of the quarter, with several factors to unpack. The U.S. economy remains on solid footing, supported by a strong labor market. Payroll growth over the last three months has averaged more than 71,000 new jobs per month, higher than the average monthly job gain of just over 50,000 jobs over the past 12 months. The unemployment rate is 4.1%, and it drops to 3.4% among people aged 25 and older. Jobless claims have also remained low and were below 200,000 during the last few weeks of the quarter.
One area of weakness is wage growth, which has recently had difficulty keeping pace with inflation. Consumer confidence also remains pressured. Consumer spending, however, continues to trend upward. Gross Domestic Product (GDP), which increased by an estimated 2.2% in the second quarter, was driven by consumer spending that rose at a seasonally adjusted annualized rate of 3.8%. Retail and food services sales are up 5.2% year-to-date through August compared with the prior year. Consumers also continue to increase online spending, with online sales up 10.3% during the same period.
Investment in artificial intelligence (AI) continues to grow, including spending on software and information-processing equipment. Data center construction is also rising. According to the U.S. Census Bureau, the value of data center construction put in place in August was 73% higher than a year earlier, reaching a seasonally adjusted annual rate (SAAR) of more than $84 billion and we continue to see growth in the level of spending (Figure 2).
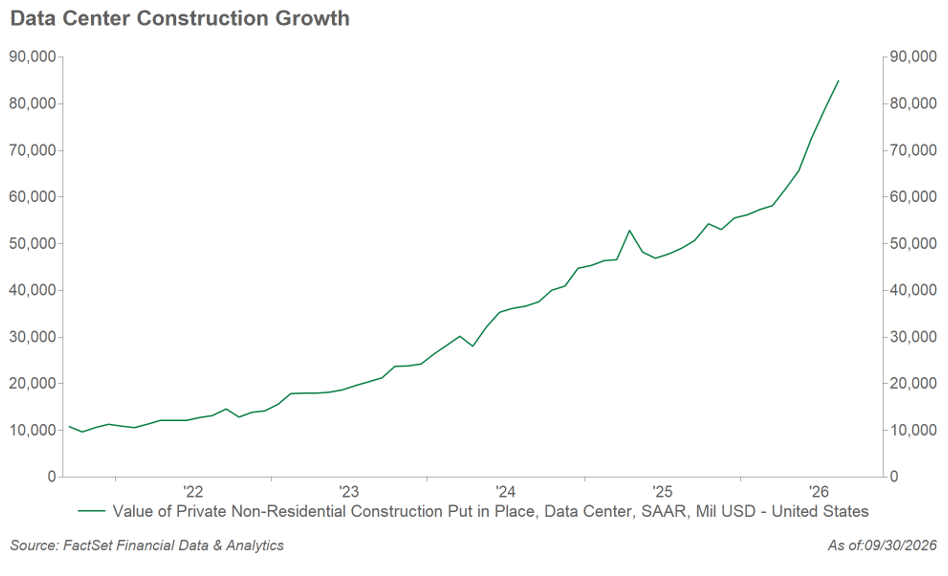 Figure 2
Fed’s focus on inflation
Inflation, while below its recent peak, remains above the Federal Reserve’s 2% target. Energy continues to be the culprit, with Brent crude oil prices ending the quarter at $98 per barrel as the Iran war enters its eighth month in October. The cadence of escalation and de-escalation has further heightened geopolitical uncertainty and pushed diesel prices to all-time highs, with national averages above $6.50 per gallon (Figure 3).
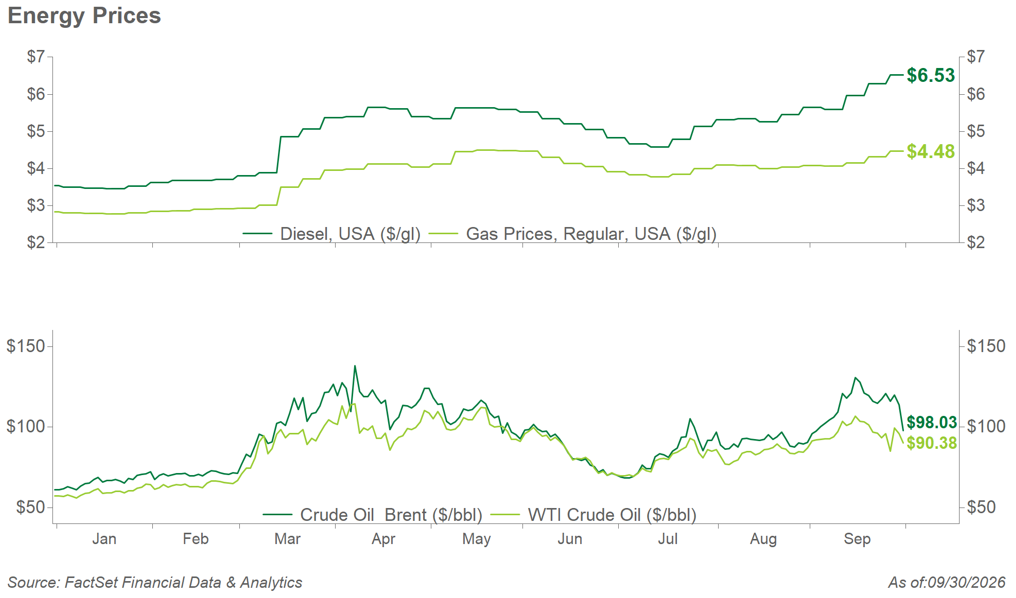 Figure 3
The Federal Reserve has a dual mandate: maximum employment and stable prices. At the September Federal Open Market Committee (FOMC) meeting, the Fed noted that economic activity remains strong and inflation remains elevated. Current financial conditions were also characterized as “accommodative.” The Committee chose to raise rates by 0.25% to a range of 3.75% to 4% to remove some of the accommodation, and its focus moving forward will be on bringing inflation down.
The Fed is not the only central bank raising rates. The European Central Bank (ECB) first raised its Deposit Facility Rate by 0.25% in June to bring inflation under control, and the Bank of Japan raised rates in both June and September. Globally, interest rates are rising, creating a stronger setup for future bond returns.
Growing earnings expectations
Continuing a trend observed over the last few months, we view rising earnings growth expectations as the primary contributor to the positive stock market returns seen this year (Figure 4). Despite rising share prices, we also believe earnings growth has supported large-cap valuations, as the S&P 500 forward price-to-earnings ratio continues to trade in line with its 10-year average.
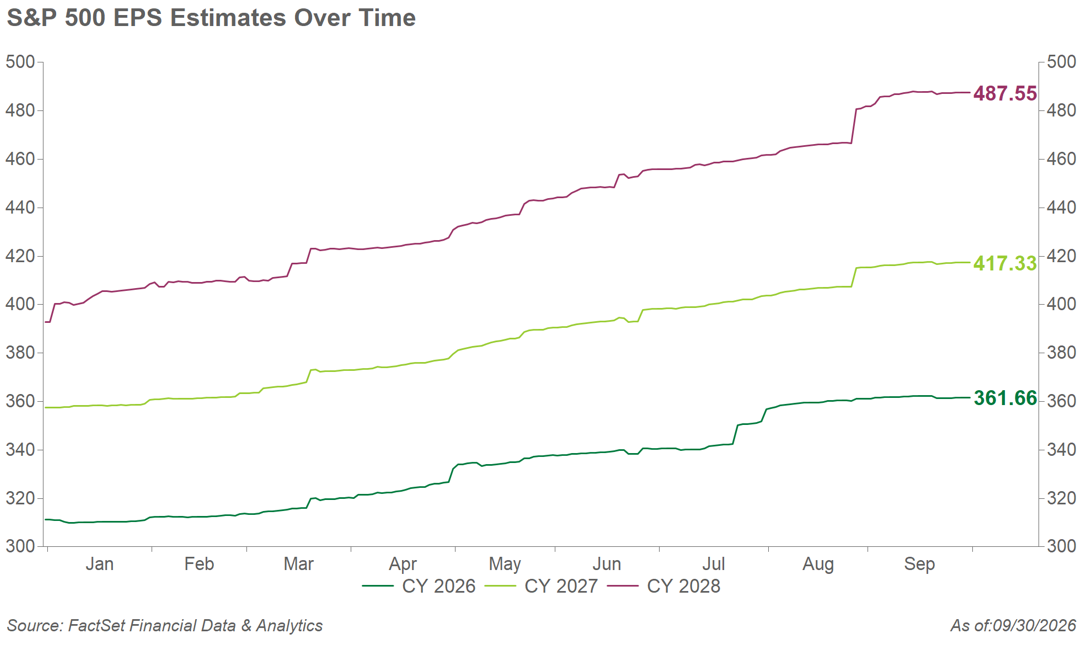 Figure 4
After a strong start to the year, small-cap stocks struggled in the third quarter, declining 7.2% and lagging their large-cap peers. Despite very strong earnings growth expectations among small-cap stocks, we remain neutral across market capitalizations in equity portfolios. Following early-year outperformance and given that a large percentage of the small-cap universe consists of companies that are not currently profitable, valuations do not appear as attractive to us as those of mid-cap and large-cap stocks.
Growth vs. value
As we evaluate returns across the market capitalization spectrum, we also observe distinctions between growth stocks and value stocks. Generally, value stocks are companies whose shares look inexpensive relative to their assets or earnings, while growth stocks are companies expected to grow sales and profits faster than the overall market. Despite continued strong earnings growth expectations discussed above, we have seen value stocks outperform growth stocks so far this year, which is a reversal of the trend of growth dominance that has spanned more than a decade (Figure 5).
As we investigated the trends driving the return gap between growth and value stocks, we found an interesting distinction: some of the stocks that contributed most to the Russell 1000 Value Index’s total return so far this year were also among the largest detractors from the Russell 1000 Growth Index’s return. This divergence reflects the timing of benchmark rebalancing and how the stocks within each benchmark performed and changed after the last rebalance.
This is related to an observation we made last quarter: before the June rebalance, the largest stocks in the Russell 2000 Index contributed most of the small-cap index’s return.
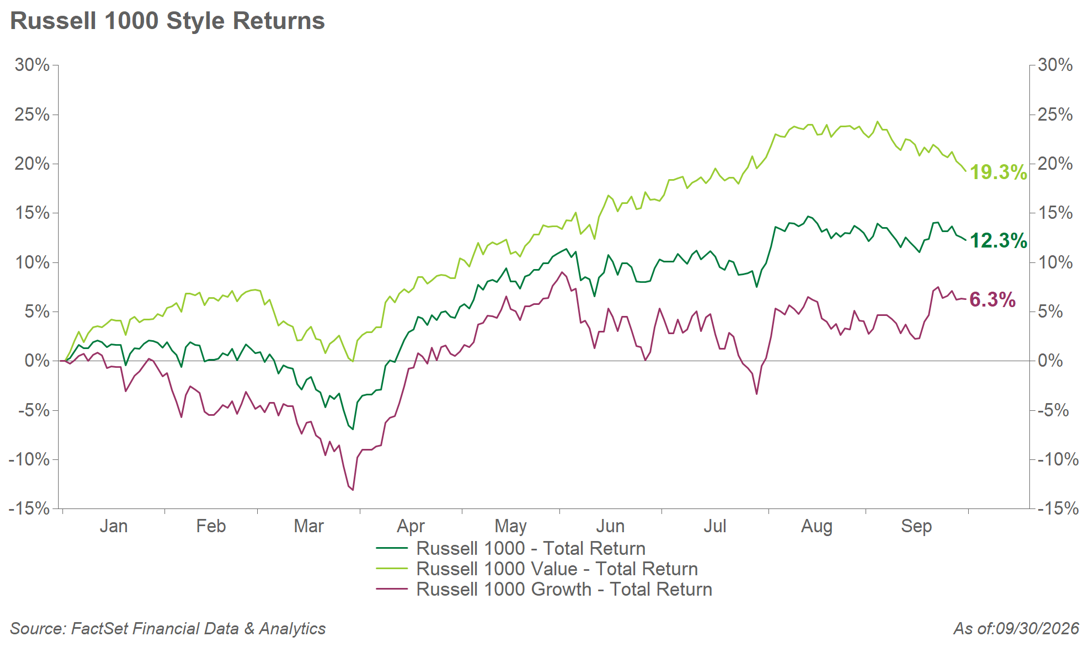 Figure 5
As the AI buildout accelerated, memory-related companies such as SanDisk and Micron experienced sharp gains in share prices and earnings growth early in the year, while technology companies such as Microsoft lagged. At the late-June index rebalance, several of these memory-related stocks moved from the Russell Value Index to the Russell Growth Index, while some of the recently lagging technology stocks increased their weight in the value index. When performance among memory-related stocks weakened in mid-summer, stocks that had previously been strong began to struggle just as they entered the growth index. As a result, the value index benefited from the returns these stocks generated before the rebalance without experiencing the effects of their mid-summer weakness.
Earnings growth expectations, valuations, and understanding the underlying drivers of market returns are all factors we consider when making portfolio decisions. While we remain constructive on stocks overall, we continually strive to balance risk and opportunity across the investable universe. After nearly four years of extremely strong equity returns, these factors led to our decision to move to a neutral position between stocks and bonds in multi-asset portfolios.
Prices down, yields up
One of the more unusual developments in this market cycle has been the behavior of longer-term interest rates. Historically, when the Federal Reserve lowers short-term interest rates, yields on longer-term bonds tend to decline as well. This cycle has been different.
Since the Federal Reserve began easing policy in September 2024, longer-term Treasury yields moved higher rather than lower. Investors have demanded greater compensation for lending over extended periods, reflecting concerns about persistent inflation, resilient economic growth, and the growing supply of Treasury securities coming to market.
The rise in longer-term rates has effectively tightened financial conditions despite the Fed's efforts to ease policy. As a result, policymakers had to contend with a market that was moving in the opposite direction of traditional monetary accommodation. This dynamic ultimately contributed to the Federal Reserve's decision to raise the federal funds rate by 0.25% on September 16th.
The recent rise in the 10-year Treasury yield above 5% has become a focal point for investors. Although the 5% threshold is partly psychological, it highlights a broader shift in the investment landscape. Importantly, today’s interest-rate environment may be less “high” and more “normal” when viewed through a longer historical lens. Prior to the Global Financial Crisis, 10-year Treasury yields frequently traded near current levels. What feels unusual today may simply reflect a transition away from the exceptionally low-rate environment investors experienced for much of the last 18 years. For investors, however, higher yields are not necessarily bad news. While rising interest rates can create short-term price volatility, they can also enhance the long-term return potential of bonds.
The trend of higher rates is not unique to the United States. As shown in the accompanying chart, long-term government bond yields have risen across most developed economies, including the United Kingdom, Germany, Japan, and Italy (Figure 6). The broad-based nature of this move suggests investors globally are recalibrating expectations for economic growth, inflation, fiscal policy, and long-term financing needs. Increased borrowing to fund government deficits and large-scale investments in artificial intelligence has contributed to a growing demand for capital worldwide.
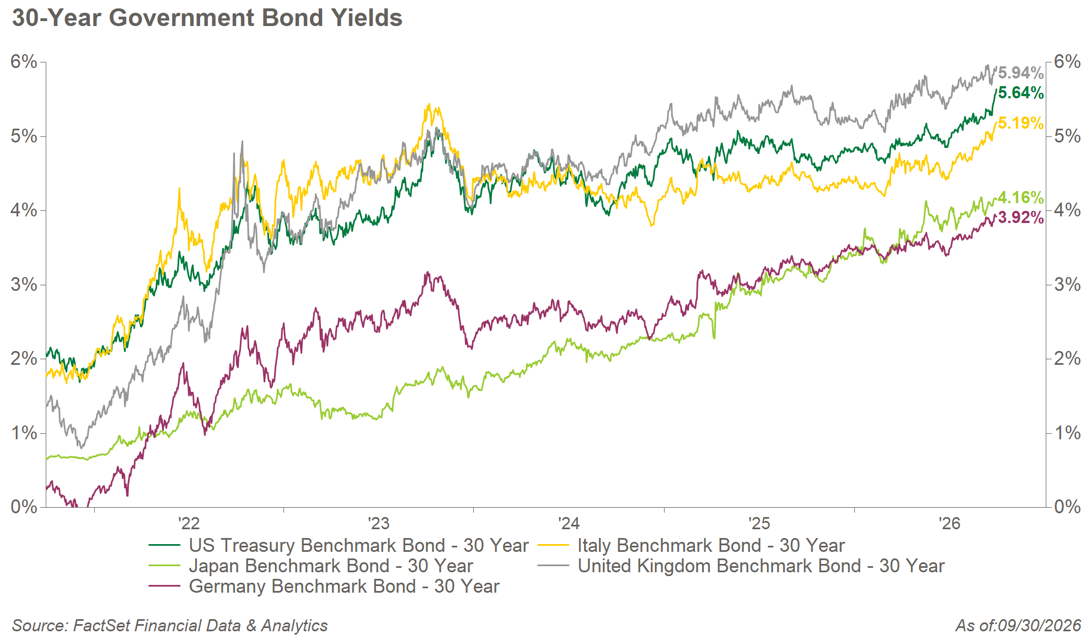 Figure 6
Income strikes back
Many investors remain hesitant about bonds after the challenging market conditions in 2022. While cash yields may appear attractive today, the income they generate will fluctuate as short-term interest rates change. Intermediate-term bonds, by contrast, allow investors to lock in today's higher yields for an extended period while also offering the potential for price appreciation if interest rates decline.
Importantly, investors should remember that existing bonds and bond funds have already adjusted in price to reflect today's higher-rate environment. Selling an existing bond simply to purchase a newly issued bond with a higher coupon generally does not create additional value, as the market has already repriced older bonds to provide competitive yields. For this reason, we continue to focus on yield-to-maturity and expected total return rather than headline coupon rates alone.
Ultimately, the role of bonds is not to eliminate risk but to help manage portfolio volatility. While stocks and bonds can occasionally decline together, high-quality fixed income continues to play a key role by generating income and helping diversify equity risk over time. Even if interest rates remain higher for longer, today’s starting yields provide a larger cushion against volatility and improve future return expectations. In our view, the most compelling argument for bonds today is simple: fixed-income investors are finally getting paid, making high-quality bonds a viable component of a diversified portfolio.
The bottom line
As we look toward the end of the year, we would not be surprised if volatility is elevated as markets respond to evolving inflation trends, midterm elections, and geopolitical developments. One of the greatest challenges for investors is resisting the urge to react to every headline, market fluctuation, or short-term shift in performance. Too often, frequent portfolio adjustments can distract from the factors that drive long-term success. Our goal is not to make perfect decisions every quarter, but to maintain a disciplined investment strategy designed to generate consistent returns over time.
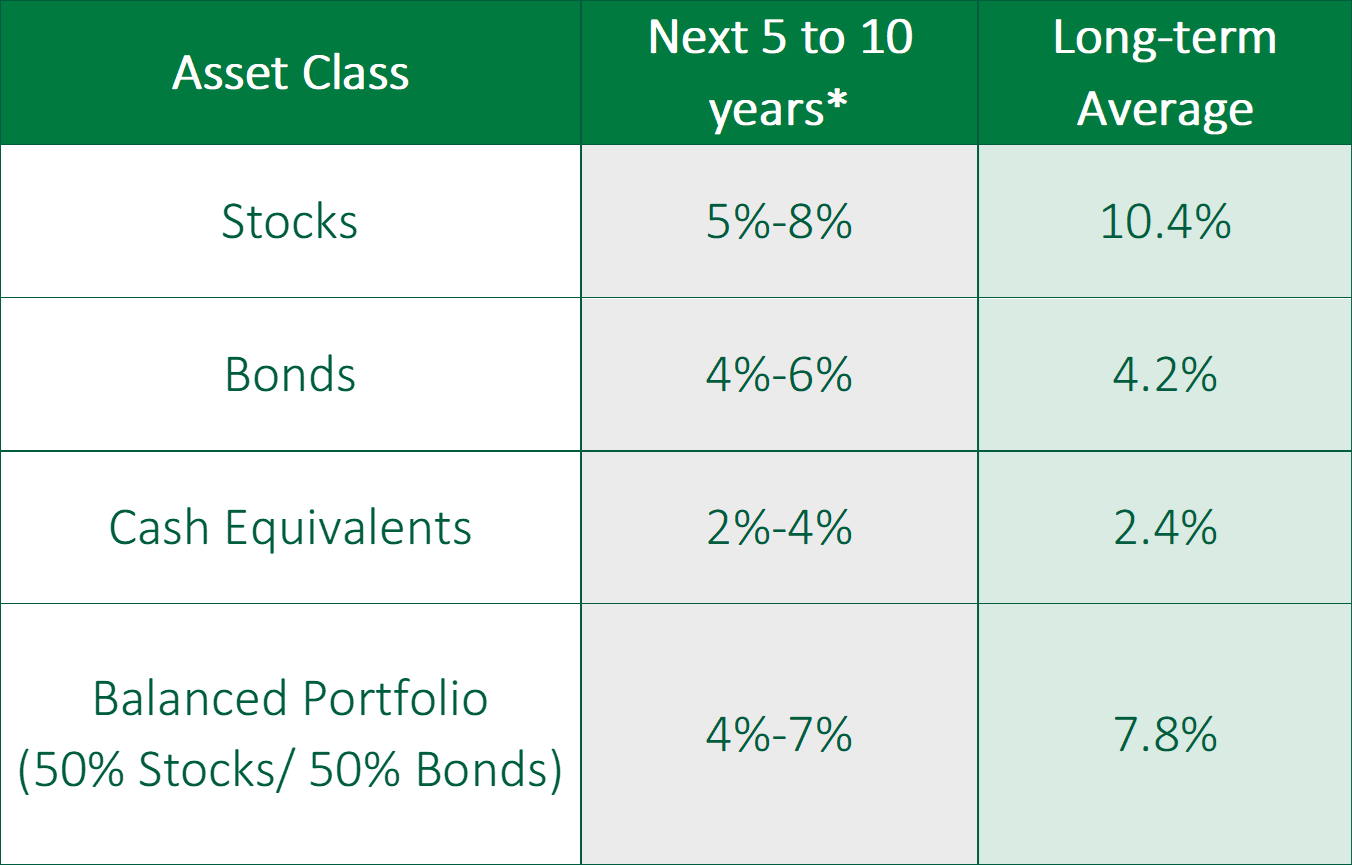 Figure 7
*Forecasted average annual returns from COUNTRY Trust Bank Wealth Management
Source: COUNTRY Trust Bank, FactSet Financial Data & Analytics - See Definitions and Important Information below
COUNTRY Trust Bank® Wealth Management Team
- Troy Frerichs, CFA - VP, Investment Services
- Kent Anderson, CFA - Portfolio Manager
- Weston Chenoweth -Investment Analyst
- Jonathan Strok, CFA - Portfolio Manager
- Michelle Beckler - Investment Analyst
- Jeff Hank, CFA, CFP® - Manager, Wealth Management
- G. Ryan Hypke, CFA, CFP® - Portfolio Manager
- Beau Lartz, ChFC® - Investment Analyst
- Emily Meldrum, CPA - Investment Analyst
- Samantha Reichert - Investment Analyst
COUNTRY Financial® is a family of affiliated companies (collectively, COUNTRY) located in Bloomington, IL. Learn more about who we are.
NOT FDIC-INSURED
May lose value
No bank guarantee
All information is as of the report date unless otherwise noted.
This material is provided for informational purposes only and should not be used or construed as investment advice or a recommendation of any security, sector, or investment strategy. All views expressed and forward-looking information, including forecasts and estimates, are based on the information available at the time of writing, do not provide a complete analysis of every material fact, and may change based on market or other conditions. Statements of fact are from sources considered reliable, but no representation or warranty is made as to their completeness or accuracy. Unless otherwise noted, the analysis and opinions provided are those of the COUNTRY Trust Bank investment team identified above and not necessarily those of COUNTRY Trust Bank or its affiliates.
Diversification, asset allocation and rebalancing do not assure a profit or guarantee against loss. All market indexes are unmanaged, and returns do not include fees and expenses associated with investing in securities. It is not possible to invest directly in an index.
Investment management, retirement, trust and planning services provided by COUNTRY Trust Bank®.
Past performance does not guarantee future results. All investing involves risk, including risk of loss.
Definitions and Important Information
Figures 1,2,3,4,5,6: Data sourced from FactSet Research Systems Inc, a global provider of integrated financial information, analytical applications and services for the investment and corporate communities.
Figure 7: The long-term average return data comes from FactSet Research Systems Inc and is based upon compound average annual returns for the period from January 1, 1996 through December 31, 2025. Stocks are represented by the S&P 500® Composite Index. Bonds are represented by the Bloomberg U.S. Aggregate Bond Index. Cash Equivalents are represented by the ICE BofA US 3-Month Treasury Bill Index. The “Balanced Portfolio” is representative of an investment of 50% stocks and 50% bonds rebalanced daily. COUNTRY Trust Bank forecasted stock returns include small capitalization and international equities. Forecasted bond returns include investment-grade bonds as well as below investment-grade bonds. These returns are for illustrative purposes and not indicative of actual portfolio performance. It is not possible to invest directly in an index.
Stocks of small-capitalization companies involve substantial risk. These stocks historically have experienced greater price volatility than stocks of larger companies, and they may be expected to do so in the future.
International investing involves risks not typically associated with domestic investing, including risks of adverse currency fluctuations, potential political and economic instability, different accounting standards, limited liquidity, and volatile prices.
Fixed income securities are subject to various risks, including changes in interest rates, credit quality, market valuations, liquidity, prepayments, early redemption, corporate events, tax ramifications and other factors. Debt securities typically decrease in value when interest rates rise. The risk is usually greater for longer-term debt securities. Investments in lower-rated and nonrated securities present a greater risk of loss.
The yield curve plots the interest rates of similar-quality bonds against their maturities. The most common yield curve plots the yields of U.S. Treasury securities for various maturities. An inverted yield curve occurs when short-term rates are higher than long-term rates.
The S&P 500® Index is an unmanaged index consisting of 500 large cap U.S. stocks. The index does not reflect investment management fees; brokerage commission and other expenses associated with investing in equity securities.
The S&P Midcap 400 is a stock market index published by Standard & Poor’s (S&P). It measures the performance of 400 mid-sized companies in the United States, providing a benchmark for this segment of the market.
The Russell 2000® Index measures the performance of the small-cap segment of the U.S. equity universe. It includes approximately 2000 of the smallest securities based on a combination of their market cap and current index membership.
The MSCI EAFE Index measures international equity performance. It comprises the MSCI country indexes capturing large and mid-cap equities across developed markets in Europe, Australasia, and the Far East, excluding the U.S. and Canada.
The MSCI Emerging Markets Index captures large and mid-cap representation across 23 emerging market countries. The index covers approximately 85% of the free float-adjusted market capitalization in each country.
The Bloomberg Aggregate Bond Index, often referred to as “the Agg,” is a broad-based benchmark that measures the performance of the U.S. investment-grade bond market. It includes a wide range of fixed-income securities.
The Russell 1000 Index measures the performance of the largest U.S. publicly traded companies. The Russell 1000 Growth Index and Russell 1000 Value Index are subsets of the Russell 1000 Index that represent companies exhibiting growth-oriented and value-oriented characteristics, respectively.
Brent Crude is a globally recognized benchmark grade of crude oil, sourced from the North Sea, used as a primary reference for international oil pricing (quoted per barrel).
The price-to-earnings ratio is a valuation ratio which compares a company's current share price with its earnings per share (EPS). EPS is usually from the last four quarters (trailing P/E), but sometimes it can be derived from the estimates of earnings expected in the next four quarters (projected or forward P/E). The ratio is also sometimes known as "price multiple" or "earnings multiple."
The federal funds rate is the interest rate at which depository institutions (like banks and credit unions) lend reserve balances to other depository institutions overnight on an uncollateralized basis. This rate is a key tool of U.S. monetary policy, set by the Federal Open Market Committee (FOMC) of the Federal Reserve. Changes in the federal funds rate can influence various economic factors, including inflation, employment, and the rates on consumer loans and mortgages.
Yield to Maturity (YTM) represents the total rate of return an investor can expect from a bond if they hold it until maturity and reinvest all interest payments at the same rate. It’s expressed as an annual percentage.
Credit spreads measure the difference in yields between bonds with the same maturity but different credit quality.
Duration — A measure of a bond's (or bond portfolio's) sensitivity to changes in interest rates; the longer the duration, the greater the price impact from a given rate move.
Gross Domestic Product (GDP) — A broad measure of a country's economic output, representing the value of all goods and services produced over a specified period.
Seasonally Adjusted Annual Rate (SAAR): A measure that adjusts data for normal seasonal patterns and expresses the result as an annualized rate, indicating what activity would be over a full year if the current pace continued.