Elections, Markets and Your Money
How have the outcomes of the past presidential elections impacted the stock market in the short-run?
The stock market can be a volatile investing environment, especially in the short-term. Presidential elections can affect expectations for taxes, trade, regulation, and government spending, which may cause markets to rise and fall on a minute-to-minute basis.
Looking back to the election won by Lyndon Johnson in 1964, 5 out of 15 times the S&P 500 Index was negative over the 12 months following the election, meaning that 10 out 15 times it was positive. The average loss for the five negative events was (12.60%). The average gain for the ten positive events was 20.04%.
Economic growth, inflation, interest rates, corporate earnings, valuations, and unexpected events can be more important drivers of investment results. Keep in mind that if you’re investing in the stock market, you really should have a much longer investment time horizon than just 12 months.
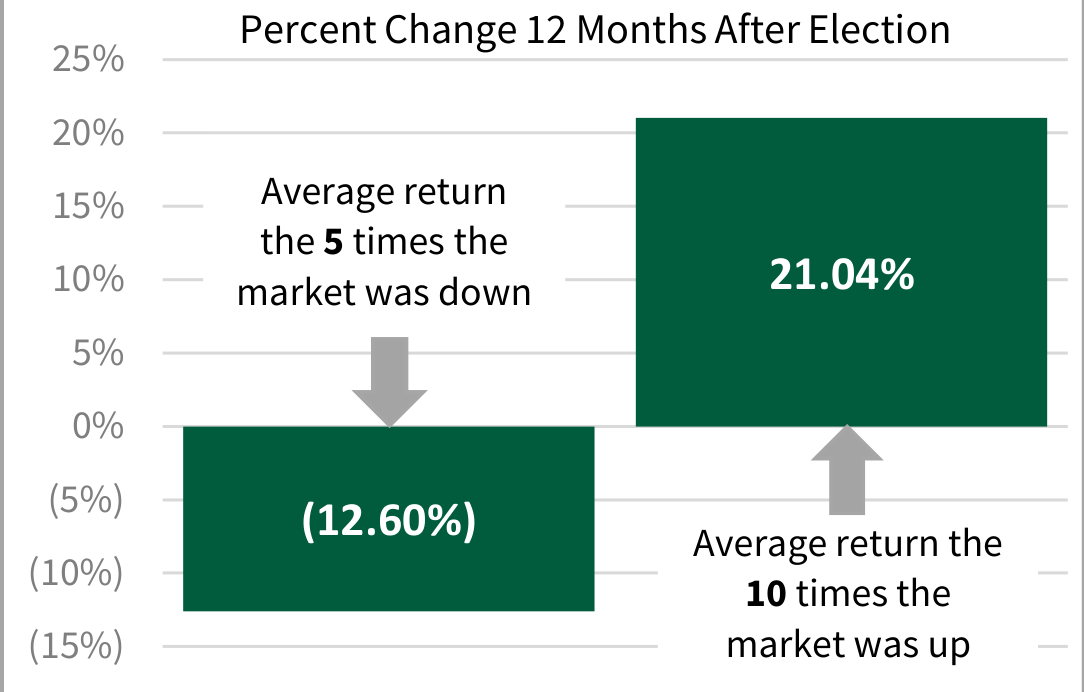 Figure 1
How have the outcomes of past presidential election impacted the stock market in the long-run?
Investors in the stock market have historically been rewarded for remaining invested over long periods of time. Looking at the chart below, investors who remained invested in the S&P 500 for the 10 years following each presidential election experienced positive annualized returns in 12 of 14 periods. The average 10-year compound annualized return (including dividends) following these elections was approximately 7.51%. Results ranged from a low of -2.72% annualized following George W. Bush’s 2000 election to a high of 14.66% following George H.W. Bush's 1988 election. More recently, investors who stayed invested during the decade following Barack Obama's 2008 and 2012 elections earned annualized returns of 6.18% and 14.25%, respectively.
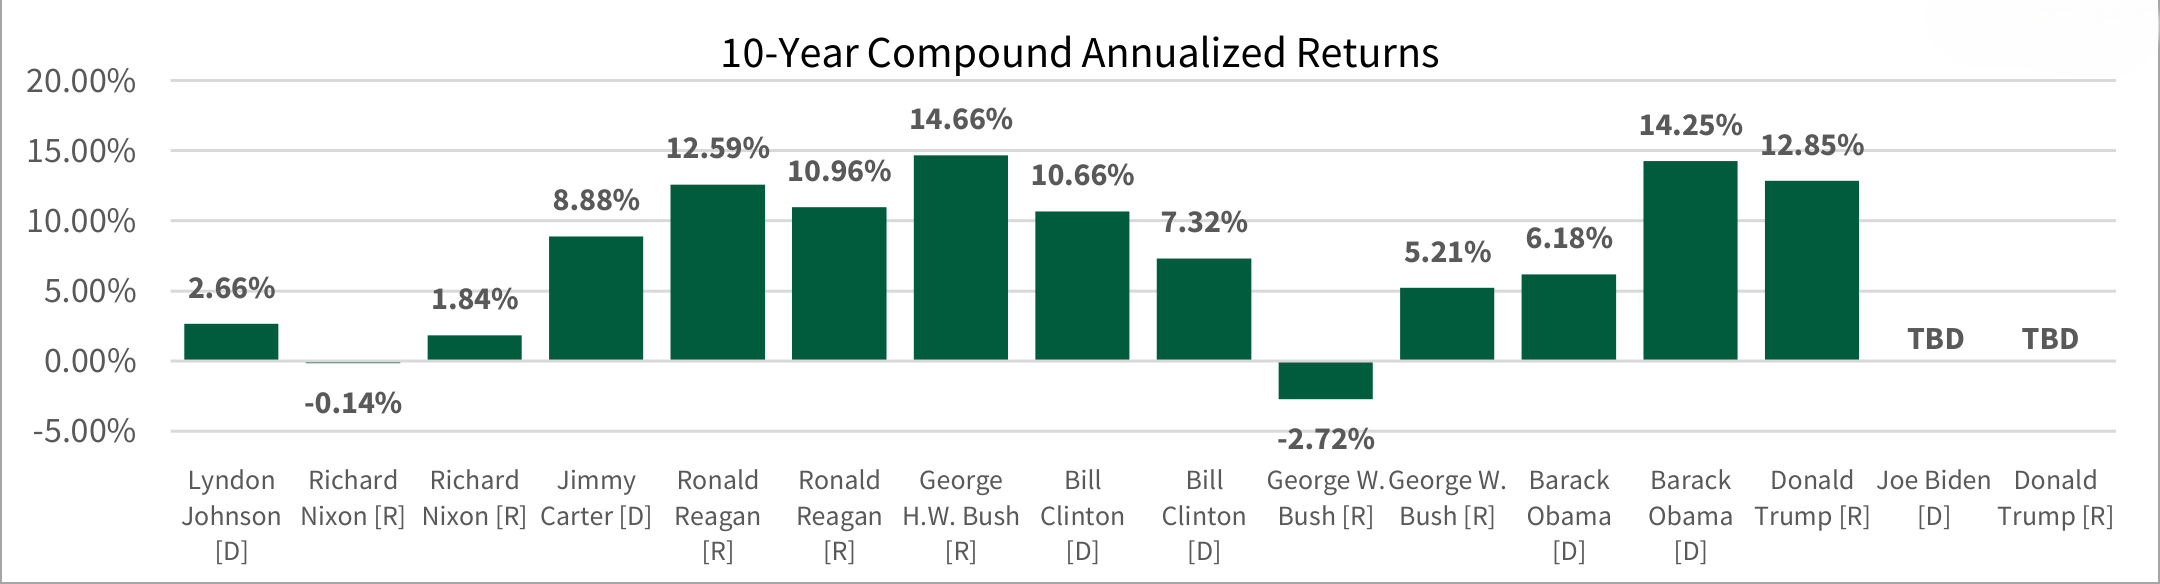 Figure 2
While return outcomes varied considerably across administrations, the results were driven primarily by economic growth, inflation, interest rates, corporate earnings, productivity, and innovation rather than by the political party occupying the White House. The consistency of positive long-term returns across every completed election cycle reinforces a key lesson for investors: market performance has historically depended far more on economic and business fundamentals than on which candidate wins an election, highlighting the value of staying invested through changing political environments.
Does the winning party determine investment results?
Looking beyond the party occupying the White House, historical data suggests that the broader structure of government may have had a modest relationship with market returns. According to research from Carson Group covering 1951 through 2023, the S&P 500 generated an average annual return of 9.9% during periods of divided government, compared to 8.0% when a single party controlled both the White House and Congress.
However, returns were positive under a wide range of political configurations. For example, the highest average annual returns occurred when a Democratic president served alongside a Republican Congress (16.3%) and when Congress itself was divided (15.7% to 13.7%, depending on the presidency).
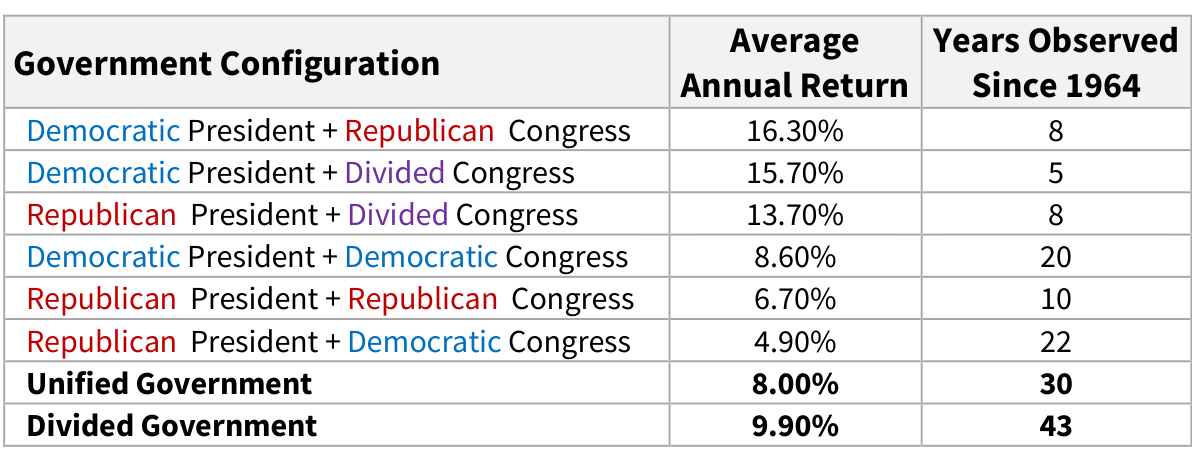 Figure 3
Looking at year by year results, you can see (Figure 4) that returns were typically positive, regardless of who was in office. When evaluated over full presidential terms (Figure 5), that general conclusion still holds true.
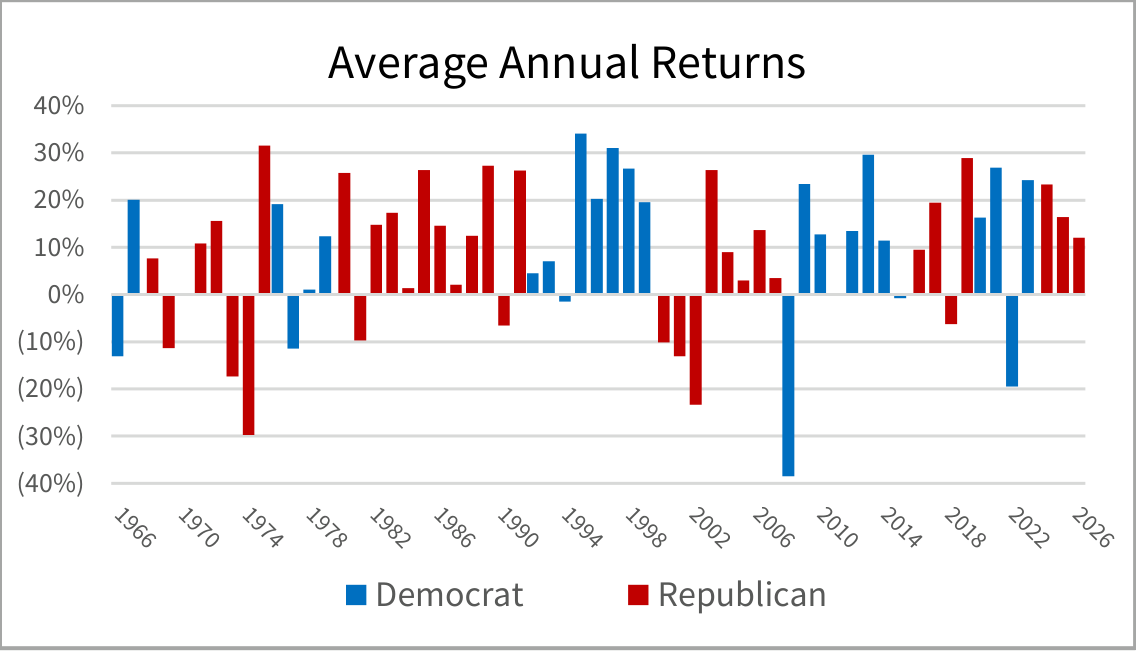 Figure 4
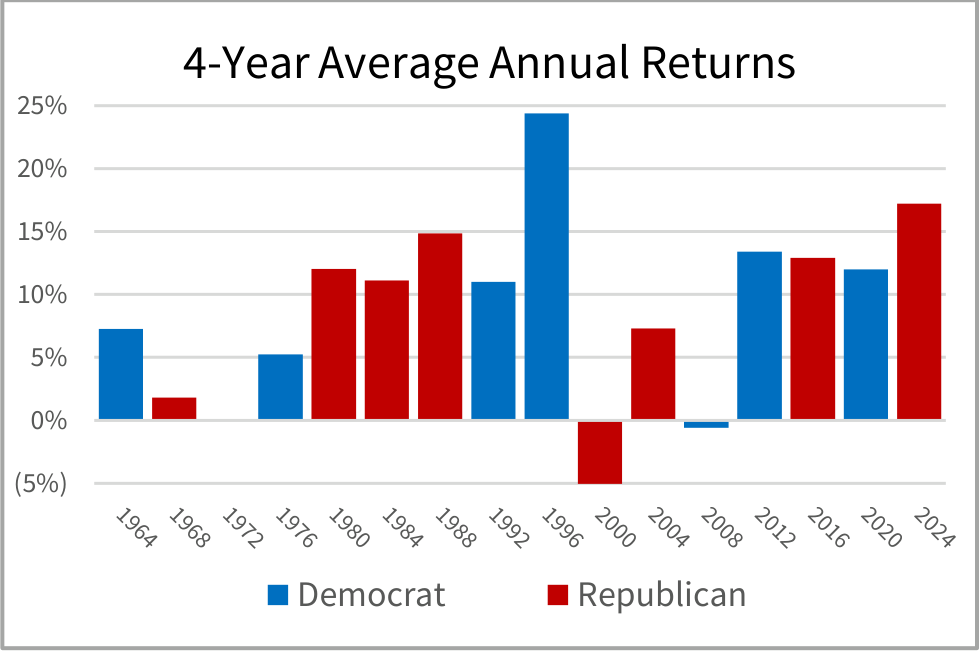 Figure 5
While these figures may be interesting from a historical perspective, they do not establish a causal relationship between political structure and investment performance. Instead, they reinforce the broader theme that markets have historically been capable of producing positive returns under many different political environments, suggesting that economic growth, corporate earnings, interest rates, and other fundamental factors remain more important drivers of long-term investment outcomes than the specific configuration of government.
A long-term plan should therefore be built around goals, risk capacity, diversification, costs, and time horizon rather than a forecast of which party will win.
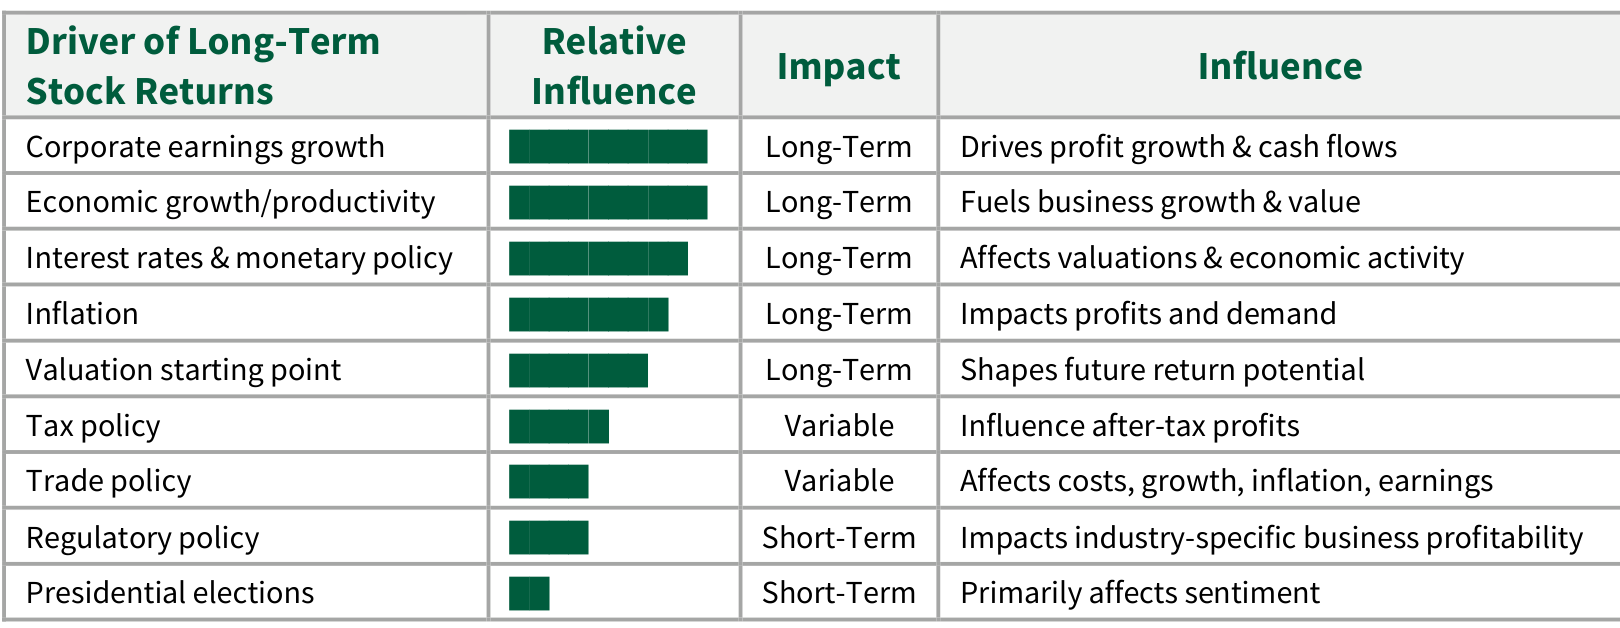 Figure 6
Should I just sit things out on the sidelines until everything is over? Won’t the election make things riskier?
While presidential elections often receive significant media attention and can create short-term uncertainty, history suggests they have had relatively little impact on overall stock market volatility. As illustrated below, the S&P 500's average volatility during election years was generally similar to or lower than volatility experienced during non-election years both before and after Election Day. In fact, volatility was lower during election years in seven of the eight time periods shown. This historical pattern suggests that broader economic and market fundamentals, rather than election outcomes themselves, have been the primary drivers of market behavior over time. For long-term investors, maintaining focus on those fundamentals has generally been more important than attempting to anticipate election-related market movements.
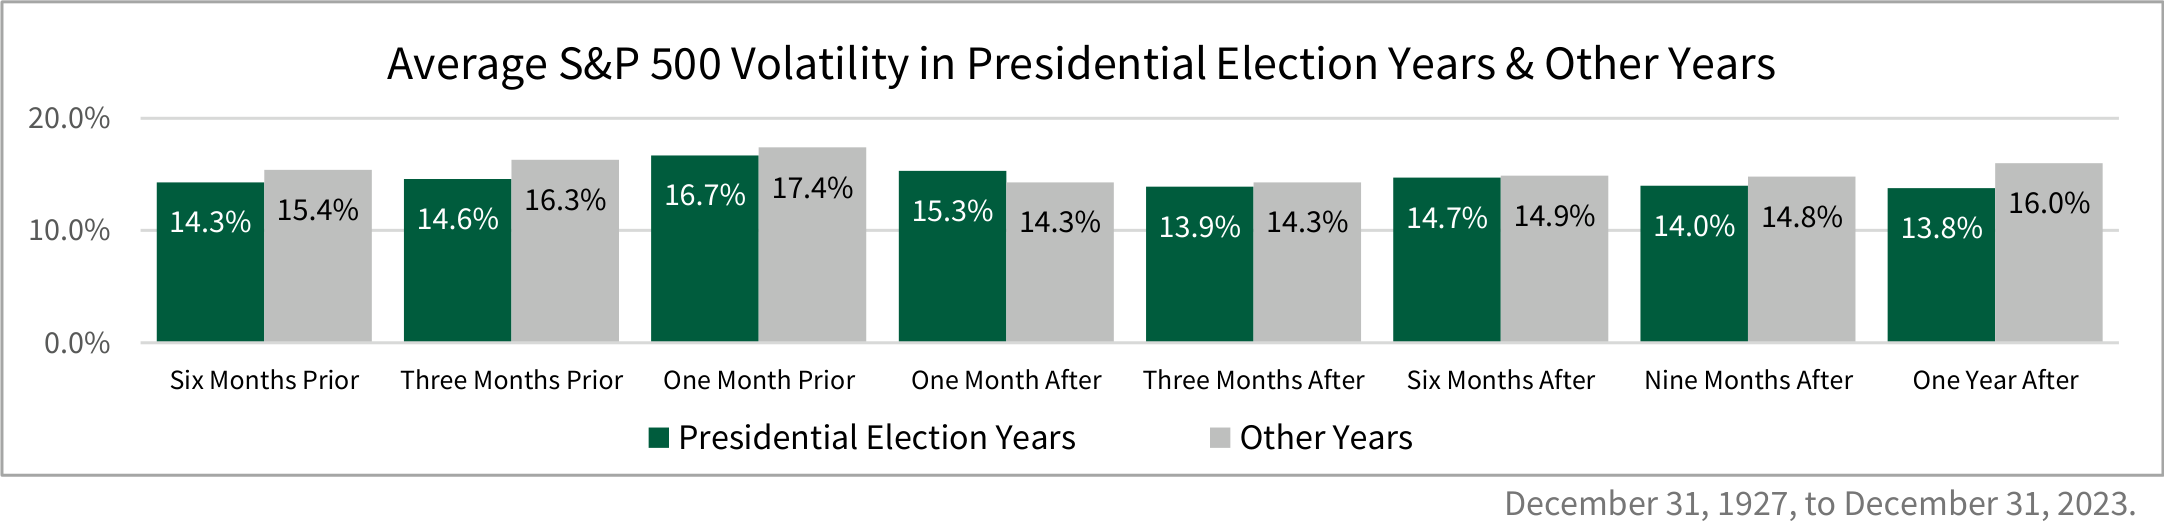 Figure 7
What has changed since the last release in 2024?
Since the original release of this article in 2024, the S&P 500 delivered total returns of 25.02% in 2024 and 17.88% in 2025, while the Federal Reserve lowered its target federal funds rate range to 3.50% to 3.75%, before recently raising it to 3.75% to 4.00% on September 16, 2026. Despite significant attention surrounding the 2024 election, market performance continued to be driven primarily by economic growth, corporate earnings, inflation trends, and interest-rate expectations rather than political outcomes. These results reinforce a key theme of this analysis: while elections can influence short-term sentiment, long-term investment success has historically depended more on economic and market fundamentals than on which party occupies the White House.
Summary
Elections matter for public policy and can affect market expectations, but history does not provide a reliable formula for turning election outcomes into short-term trades. The evidence is more consistent with maintaining a diversified portfolio, matching risk to the investor’s goals and time horizon, and evaluating policy changes through their effects on earnings, inflation, interest rates, and economic growth. Investors should avoid treating a small number of election observations as a prediction about the next market cycle.
Practical planning takeaways
- Building and maintaining an emergency reserve is important. A common target is three to six months of essential spending in a safe, liquid, accessible account, adjusted for job stability, insurance coverage, household obligations, and other available resources.
Let asset allocation do the heavy lifting. A diversified mix of stocks, bonds, and cash aligned with the goal and risk profile is generally more consequential than an election forecast.
Allow dollar-cost averaging to potentially take some of the edge off the pain. Regular investing can reduce the pressure to choose a single entry point, although it does not prevent losses or guarantee a profit.
Match the investment to the time horizon. Money needed soon may call for lower-volatility, more liquid holdings. Long-term goals can often tolerate more market fluctuation.
Have a plan. A financial plan can define rebalancing rules, spending needs, tax considerations, and decision triggers before headlines test investor discipline.
Looking for help navigating your future?
Set up a meeting with your local rep to review your current policies and make sure they're up to date. We pulled together some less obvious reasons to adjust your coverage.
COUNTRY Financial® is a family of affiliated companies (collectively, COUNTRY) located in Bloomington, IL. Learn more about who we are.
References
Figures 1, 2, 4, 5
Source: Macrotrends. S&P 500 Historical Annual Returns (1927-2026). 2026.
Figure 3
Source: CNBC. What a Republican sweep in Congress could mean for the stock market—in one chart. November 2024.
Figure 6
Source: Goldman Sachs Global Investment Research. Building Long-Term Returns: Our 10-Year Forecasts. November 2025.
Source: Carson Group. The Drivers of Long-Term Stock Returns. December 2024.
Source: Fidelity. How Might Midterm Elections Impact the Stock Market? August 2026.
Figure 7
Source: T. Rowe Price. How do U.S. elections affect stock market performance. May 2024.
Federal Reserve. Implementation Note Issued July 29, 2026. 2026.
Federal Reserve Bank of St. Louis FRED. Federal Funds Effective Rate (FEDFUNDS). 2026.
Slickcharts. S&P 500 Total Returns by Year Since 1926. 2026.
Vanguard. Politics and Investing. 2025.
Yahoo Finance. S&P 500 Historical Data. 2026.
Yahoo Finance. S&P 500 Total Return Historical Data. 2026.
This information is not intended as and should not be construed to provide tax, legal, or investing advice. It is intended as an educational starting point to help you better understand the topics addressed here. COUNTRY Trust Bank and its employees do not provide tax advice. This information may omit some important aspects of tax or legal conditions you may face, which is why you should always seek out the advice of qualified tax or legal professionals of your own choosing.
Past performance does not guarantee future results. All investing involves risk, including risk of loss. Diversification, asset allocation, rebalancing, and dollar-cost averaging do not assure a profit or protect against loss. Indexes are unmanaged, do not reflect investment fees or expenses, and cannot be invested in directly. This material is for informational and educational purposes only and is not investment, tax, or legal advice. Consult qualified professionals regarding individual circumstances.
COUNTRY Trust Bank® Investment Analyst
Emily Meldrum, CPA
COUNTRY Trust Bank® Financial Planning Consultants
Bryan Daniels, CFP®, MPAS®, ChFC®, CLU®, AFFP®, AWMA®, ADPA®, CMFC®
Nick Erwin, CFP®, BFA, ChFC®, CLU®, AFFP®
Scott Jensen, CFP®, ChFC®, CLU®, RICP®, AFFP®
Lorraine Zenge, AFFP®
NOT FDIC-INSURED
May lose value
No bank guarantee
Investment management, retirement, trust and planning services provided by COUNTRY Trust Bank®.