Market and Economic Outlook - Released 9/30/20
Key takeaways
- We see signs the economic recovery is underway, but risks lurk underneath the surface.
- The Federal Reserve has aggressively addressed problems the COVID-19 pandemic has created. Congress has been slow to act.
- We continue to see pockets of opportunity in small and mid-cap U.S. stocks and international stocks due to their attractive valuations versus U.S. large caps
- High-quality bonds are not priced for the rates of return they have provided historically but continue to provide portfolio stability.
When a duck appears to be gently gliding on the pond near our offices, it isn’t effortless at all. Instead, they are vigorously paddling their webbed feet in the water to move forward. Financial markets seem to be following this same pattern. During the 3rd quarter of 2020, stock and bond market returns continued to drift higher. While we see signs the recovery is underway, risks lurk underneath the surface.
Economic data improving
Investors were calmed during the quarter by much improved economic data than we saw in the first half of the year. The economy has been quicker to bounce back than expected. Consumer spending has been strong, and retail sales are expected to be at or above where we were this time last year with gas purchases being an exception as people continue to stay at home and travel less.
Residential housing has also been a bright spot over the last few months with new residential construction permits and starts above where they were a year ago. The Federal Reserve is estimating third-quarter GDP growth will be +32% quarter-over-quarter signaling the economy is moving in the right direction.
The Federal Reserve has done more than enough to combat the problems the COVID-19 pandemic has created. On multiple occasions during the summer, the Fed stated they are supportive of keeping interest rates low to allow the economy and labor market to heal. In addition to their current bond-buying program, the Fed announced in August they will measure the average inflation rate over time when determining the direction of short-term interest rates. Many believe this provides the Fed the ability to keep the federal funds rate low, even if inflation moves above their targeted rate.
Congress on the other hand has been slow to act. In March, Congress passed the CARES Act which provided relief to businesses and individuals with one-time stimulus checks and an additional $600 per week in unemployment benefits. However, the unemployment benefits expired on July 31st, and Congress has been unable to agree on another round of stimulus measures. While unemployment has come down and is now below the 2007-09 recession, there are still improvements to be made with the rate remaining over 8% (Figure 1).
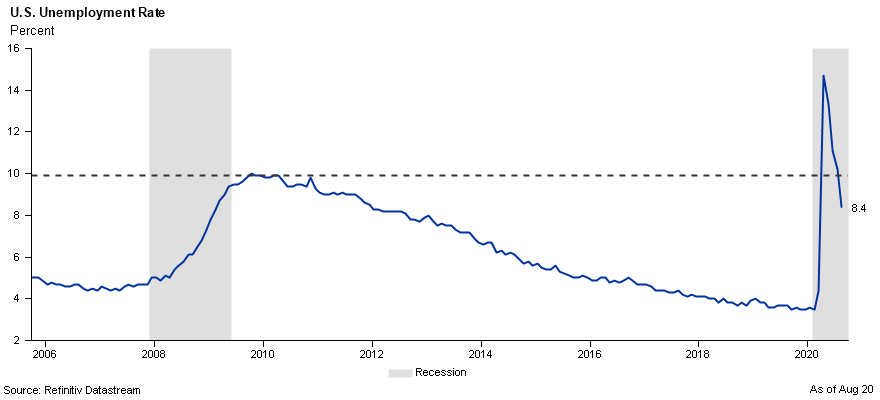 Figure 1
Additional fiscal measures are necessary in our view to support the labor market, but we see no end in sight to the contentious political environment.
Political gamesmanship along with fears of a second wave of COVID-19 infections are driving investor sentiment and we expect this to continue over the next few months. Despite this, the stock market maintained its momentum during the quarter.
Earnings estimates uncertain
The S&P 500 index’s gain is nearly 47% off the lows reached on March 23rd. While this recovery in the S&P 500 is notable, we believe caution is warranted given the contribution to returns from mega cap technology stocks. Despite improving economic data, consensus earnings forecasts for the S&P500 over the next 12 months remain well below pre COVID-19 estimates (Figure 2).
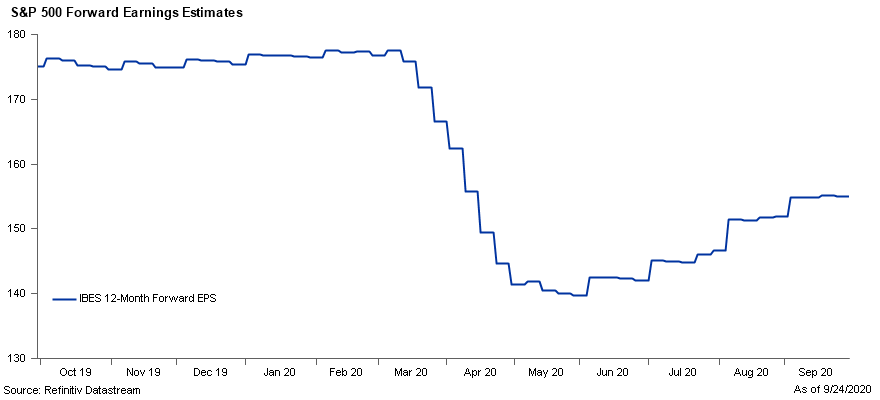 Figure 2
Using these estimates, with today’s level of the S&P 500, results in above average valuations for U.S. large cap stocks in our view. In the short term, we anticipate progress towards a return to normal economic activity will support these valuations. However, given the uncertainty surrounding this forecast we feel there are better opportunities outside of U.S. large-cap stocks. Other segments of the U.S. stock market have not recovered as robustly and remain below their record highs. We continue to see pockets of opportunity in small and mid-cap stocks due to their attractive valuations versus U.S. large caps.
International stocks provide opportunity
We also are starting to view international stocks as an area of opportunity. This view is driven by a few factors including attractive valuations, cyclical exposure in an eventual global recovery and possible depreciation of the U.S. Dollar. Despite solid performance in the 3rd quarter for non-U.S. stocks, the valuation gap relative to the U.S. continues to remain historically high (Figure 3).
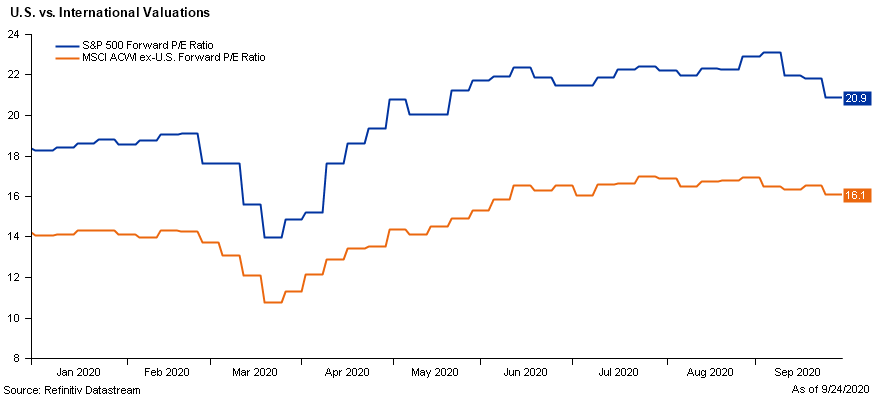 Figure 3
International stock markets are more heavily weighted in cyclical sectors like financials and materials versus the U.S. which is more heavily weighted in technology and communication services. Given the strong returns we have seen already in those segments of the U.S. stock market, we expect international stock prices to benefit during the eventual global recovery.
The US Dollar index has fallen nearly 9% since its recent peak in late March. As the dollar depreciates, it makes international trade and investment look more attractive. Given these potential tailwinds, we have a more constructive view than in recent quarters on international stocks in both developed and emerging market countries.
Bond yields likely remain low
Bond markets continued to recover over the summer after a volatile spring. Given recent statements from the Federal Reserve, it’s highly unlikely that short-term rates will move much higher. The Fed’s dot plot chart (Figure 4) records projections from the 12 members of the Federal Open Market Committee. This shows short term interest rates are expected to remain near zero for the next 3 years.
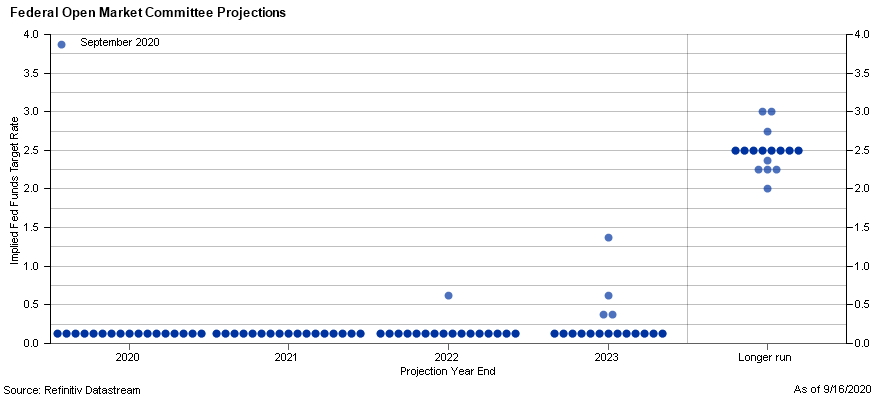 Figure 4
Although longer-term rates could begin to move a bit higher as the economy recovers, we believe they will also stay low due to muted inflation expectations. Transparency from the Fed has calmed investors concerned about credit risk and corporate bond spreads remain near record low levels.
Given our forecast for continued low rates, particularly in short term maturities, we believe most bond investors generally can extend along the curve and accept a modest amount of interest rate risk. We continue to see value in non-traditional income-producing asset classes like preferred stocks, floating-rate loans, and emerging market debt. There is additional risk in these types of investments, but they have yields well above rates on U.S. corporate bonds.
High-quality bonds are not priced for the rates of return they have provided historically but continue to provide portfolio stability during a crisis.
The bottom line
Investors are forced to deal with a challenging set of circumstances today. Record low interest rates and elevated stock market valuations are coupled with an uncertain economic outlook due to the COVID-19 pandemic. We continue to believe neither stock nor bond markets appear cheap. Within multi asset portfolios, we are taking a neutral stance between stocks and bonds.
We feel some rainy days may be in the forecast over the next few months. Days better suited for a duck. However, investors should fight the urge to fly away in these conditions and keep paddling along. We believe creating a portfolio that is consistent with your personal needs, that meets your risk profile and time horizon, leveraged with a trusted financial professional, is the best approach in these uncertain times.
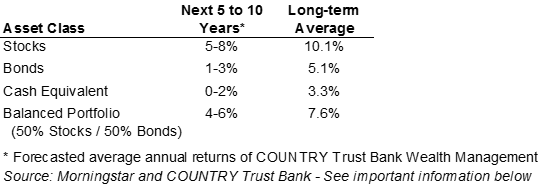 Figure 5
COUNTRY Trust Bank wealth management team
- Troy Frerichs, CFA - VP, Investment Services
- Jeff Hank, CFA, CFP® - Manager, Wealth Management
- G. Ryan Hypke, CFA - Portfolio Manager
- Weston Chenoweth - Investment Analyst
- Molly Ruddy - Investment Analyst
- Chelsie Moore, CFA, CFP® - Director, Wealth Management & Financial Planning
- Kent Anderson, CFA - Portfolio Manager
- Jonathan Strok, CFA - Portfolio Manager
- Jamie Czesak - Investment Analyst
Looking for help navigating your future?
Set up a meeting with your local rep to review your current policies and make sure they're up to date. We pulled together some less obvious reasons to adjust your coverage.
COUNTRY Financial® is a family of affiliated companies (collectively, COUNTRY) located in Bloomington, IL. Learn more about who we are.
NOT FDIC-INSURED
May lose value
No bank guarantee
All information is as of the report date unless otherwise noted.
This material is provided for informational purposes only and should not be used or construed as investment advice or a recommendation of any security, sector, or investment strategy. All views expressed and forward-looking information, including forecasts and estimates, are based on the information available at the time of writing, do not provide a complete analysis of every material fact, and may change based on market or other conditions. Statements of fact are from sources considered reliable, but no representation or warranty is made as to their completeness or accuracy. Unless otherwise noted, the analysis and opinions provided are those of the COUNTRY Trust Bank investment team identified above and not necessarily those of COUNTRY Trust Bank or its affiliates.
Diversification, asset allocation and rebalancing do not assure a profit or guarantee against loss. All market indexes are unmanaged, and returns do not include fees and expenses associated with investing in securities. It is not possible to invest directly in an index.
Investment management, retirement, trust and planning services provided by COUNTRY Trust Bank®.
Past performance does not guarantee future results. All investing involves risk, including risk of loss.
Definitions and Important Information
Figures 1,2,3,4,5: Chart data comes from Refinitiv (formerly Thomson Reuters) Datastream, a powerful platform that integrates top-down macroeconomic research and bottom-up fundamental analysis.
Figure 6: The long-term average return data comes from Morningstar and is based upon compound average annual returns for the period from 1926 through December 31, 2019. Stocks are represented by the Ibbotson® Large Company Stock Index, which is comprised of the S&P 500® Composite Index from 1957 to present, and the S&P 90® Index from 1926 to 1956. Bonds are represented by the Ibbotson® U.S. Intermediate-Term Government Bond Index. Cash Equivalents are represented by the 30-day U.S. Treasury bill. The “Balanced Portfolio” is representative of an investment of 50% stocks and 50% bonds rebalanced annually. Forecasted stock returns include small capitalization and international equities. Forecasted bond returns include investment grade corporate bonds. These returns are for illustrative purposes and not indicative of actual portfolio performance. It is not possible to invest directly in an index.
The S&P 500® Index is an unmanaged index consisting of 500 large-cap U.S. stocks. Since it includes a significant portion of the total value of the market, it also considered representative of the market. The index does not reflect investment management fees, brokerage commission and other expenses associated with investing in equity securities. It is not possible to invest directly in an index.
The Russell 2000® Index measures the performance of the small-cap segment of the U.S. equity universe. The Russell 2000 Index is a subset of the Russell 3000® Index representing approximately 10% of the total market capitalization of that index. It includes approximately 2000 of the smallest securities based on a combination of their market cap and current index membership. The Russell 2000 is constructed to provide a comprehensive and unbiased small-cap barometer and is completely reconstituted annually to ensure larger stocks do not distort the performance and characteristics of the true small-cap opportunity set. The Index does not reflect investment management fees, brokerage commission and other expenses associated with investing in equity securities. It is not possible to invest directly in an index.
The iShares Core U.S. Aggregate Bond ETF seeks to track the investment results of the Bloomberg Barclays US Aggregate Bond Index. The Bloomberg Barclays US Aggregate Bond Index is a broad base, market capitalization-weighted bond market index representing intermediate term investment grade bonds traded in the United States.
The MSCI EAFE Index is broadly recognized as the pre-eminent benchmark for U.S. investors to measure international equity performance. It comprises the MSCI country indexes capturing large and mid-cap equities across developed markets in Europe, Australasia and the Far East, excluding the U.S. and Canada.
The MSCI Emerging Markets Index captures large and mid-cap representation across 26 emerging market countries. The index free float-adjusted market capitalization index and represents 13% of global market capitalization.
The S&P GSCI is a widely recognized benchmark that is broad-based, and production weighted to represent the global commodity market beta. The index includes the most liquid commodity futures.
The ibex USD Benchmark index spans an array of fixed income sectors including corporate, treasuries, sovereign, sub-sovereign, supranational, and covered, with a history dating back to December 1998.
Brent Crude Oil is a trading classification of sweet light crude oil that serves as a major benchmark price for purchases of oil worldwide. Brent is the leading global price benchmark for Atlantic basin crude oils. It is used to price approximately two thirds of the world’s internationally traded crude oil supplies.
The federal funds rate is the interest rate at which depository institutions lend reserve balances to other depository institutions overnight. The Federal Open Market Committee, which is the primary monetary policymaking body of the Federal Reserve, sets its desired target range.
A basis point is equal to one hundredth of one percent. It is used chiefly in expressing differences in interest rates.
The yield curve plots the interest rates of similar-quality bonds against their maturities. The most common yield curve plots the yields of U.S. Treasury securities for various maturities. An inverted yield curve occurs when short-term rates are higher than long-term rates.
The BBB rating is a credit rating used by S&P and Fitch credit rating agencies for long term bonds and some other investments. It is equivalent to the Baa2 rating used by Moody’s. A BBB rating represents a relatively low risk bond or investment. However, it is toward the bottom of investment grade bond ratings, being only two grades above junk bond ratings.
The price-to-earnings ratio is a valuation ratio which compares a company's current share price with its earnings per share (EPS). EPS is usually from the last four quarters (trailing P/E), but sometimes it can be derived from the estimates of earnings expected in the next four quarters (projected or forward P/E). The ratio is also sometimes known as "price multiple" or "earnings multiple."
Stocks of small-capitalization companies involve substantial risk. These stocks historically have experienced greater price volatility than stocks of larger companies, and they may be expected to do so in the future.
Stocks of mid-capitalization companies may be slightly less volatile than those of small-capitalization companies but still involve substantial risk and they may be subject to more abrupt or erratic movements than large capitalization companies.
International investing involves risks not typically associated with domestic investing, including risks of adverse currency fluctuations, potential political and economic instability, different accounting standards, limited liquidity and volatile prices.
Fixed income securities are subject to various risks, including changes in interest rates, credit quality, market valuations, liquidity, prepayments, early redemption, corporate events, tax ramifications and other factors. Debt securities typically decrease in value when interest rates rise. The risk is usually greater for longer-term debt securities. Investments in lower-rated and nonrated securities present a greater risk of loss to principal and interest than higher-rated securities.
Sector investments tend to be more volatile than investments that diversify across companies in many sectors