Market and Economic Outlook - Released 12/31/19
Key takeaways
- The U.S. economy is still growing at a moderate rate supported by a strong labor market, solid consumer spending, and low interest rates.
- Elections, trade tensions, and social unrest could feed uncertainty and contribute to global market volatility in 2020.
- We continue to seek pockets of opportunities but are applying a neutral approach to our multi-asset portfolios as neither stocks nor bonds appear cheap in our view.
While 2018 is remembered as a year when almost nothing worked, 2019 turned out to be a year when almost everything did. Whether it was stocks, bonds, or commodities almost every asset class had positive total returns (Figure 1). An additional rate cut during the fourth quarter (the third for the year) by U.S. Federal Reserve helped to sustain the economic expansion and propel the S&P 500 to record highs. What a difference a year makes.
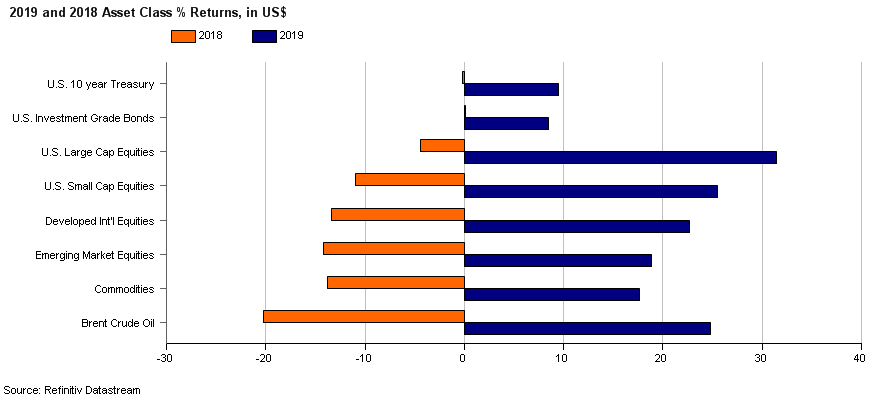 Figure 1
As Warren Buffet stated, “whether we are talking about socks or stocks, I like buying quality merchandise when it is marked down.” One can still find deals on socks, although over the decade Amazon has supplanted the mall for most shoppers. However, in our view, when it comes to investments there are few bargains to be had currently. As a result, we are maintaining our neutral stance between stocks and bonds in multi-asset portfolios.
Trade tensions ease
During the fourth quarter, global trade dominated the headlines as stock and bond prices were largely influenced by news of progress or setbacks in the trade negotiations between the U.S. and China. A Phase One trade deal was finally agreed to, and both sides are due to formally sign the agreement later in January. The deal de-escalates the tension between the world’s two largest economies and lowers the risks to global growth. However, the deal does not seem to fully address key issues such as intellectual property protection and the opening of some markets to U.S. goods. We expect these items will be part of ongoing Phase Two discussions this year and will likely generate additional headlines and market volatility in 2020.
U.S. economic expansion continues
The U.S. economic expansion continues at its moderate pace with early Q4 GDP figures looking similar to Q3’s 2.1% growth rate. The expansion, the longest in history, is now in its 11th year supported by a strong labor market, solid consumer spending, and low inflation. While it’s the longest expansion, it’s not the strongest (Figure 2), and the economy has shown few signs of the excesses that have ended past expansions.
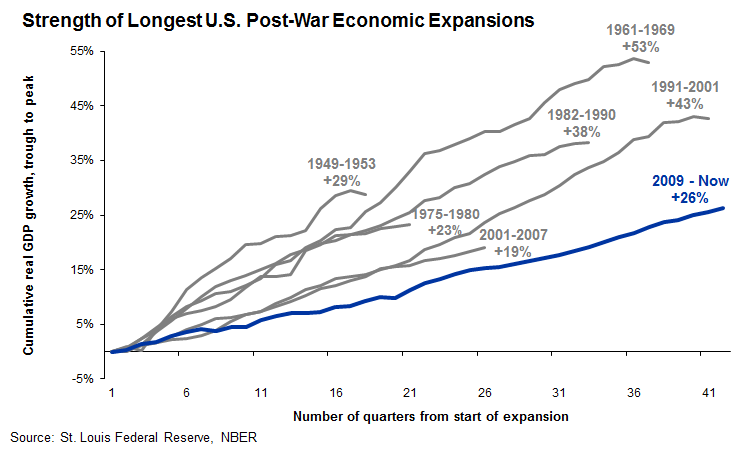 Figure 2
In a 2016 research report1, Fed researchers concluded that “expansions during the past 70 years do not become progressively more fragile with age” and “expansions, like Peter Pan, endure but never seem to grow old”. Indeed, other countries have experienced expansions that lasted far longer than ours – the UK had a 15-year expansion until 2008 and Australia is currently in the 28th year of their expansion. Given the lack of excesses and supportive macroeconomic backdrop, we do not foresee a recession in the next few quarters. However, the U.S. elections in 2020 could have a significant impact on the economy depending on the platforms and priorities of the frontrunners and eventual winner.
Corporate earnings growth
The U.S. stock market appears to be pricing in a continuation of the expansion. S&P 500 earnings growth was fairly moderate for 2019 with some sectors stronger than others. The main driver of the strong S&P 500 returns during 2019 was almost entirely due to higher price-to-earnings ratio multiples (Figure 3).
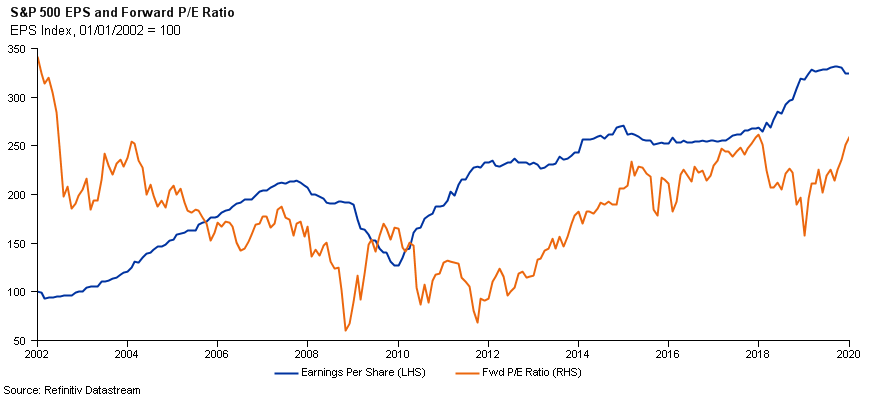 Figure 3
We are skeptical of further increases in the S&P 500’s price to earnings ratio in 2020. However, continued strength in consumer confidence, strong employment, and compelling wage growth data, could support moderate earnings growth forecasts for the year.
Despite outstanding returns during 2019, we have seen large outflows from U.S. stock mutual funds and ETFs (Figure 4). As of early December, investors had placed approximately $277 billion into U.S. bond funds, the third biggest total over the past 10 years according to Refinitiv. This may suggest that investors are relatively cautious around some of the risks present. If the outlook on any of these risks are mitigated and investors begin to allocate funds back to stocks, this could provide additional support to stock prices.
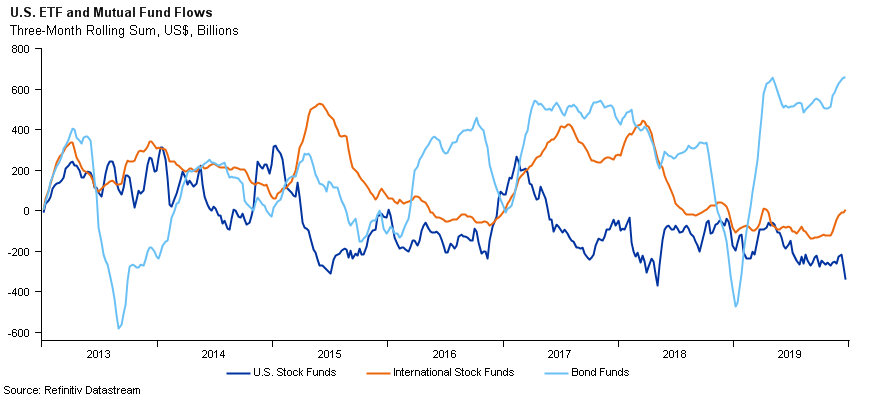 Figure 4
Bond spreads tighten
A decline in global interest rates and continued stability in corporate fundamentals resulted in an exceptional year for bond market returns. When the Treasury yield curve inverted this summer, it caused concerns about an economic slowdown. However, the Fed’s rate cuts, along with Treasury bill purchases to improve functioning of the short-term lending markets calmed investors. Against this backdrop, longer term bonds with lower credit quality produced the strongest returns for 2019.
The steady economic environment and demand for income has caused the spread on U.S. corporate bonds rated BBB to continue to tighten. (Figure 5) In early December, the average yield spread of the JP Morgan U.S. Liquid Corporate Bond Index was only 1.08% over similar maturity Treasury bonds. This level remains near the record low spreads experienced in 2005. Commercial mortgage rates are also at record lows and below investment grade companies can easily borrow at very attractive rates. These factors lead us to believe investors aren’t being paid to take risk in bonds.
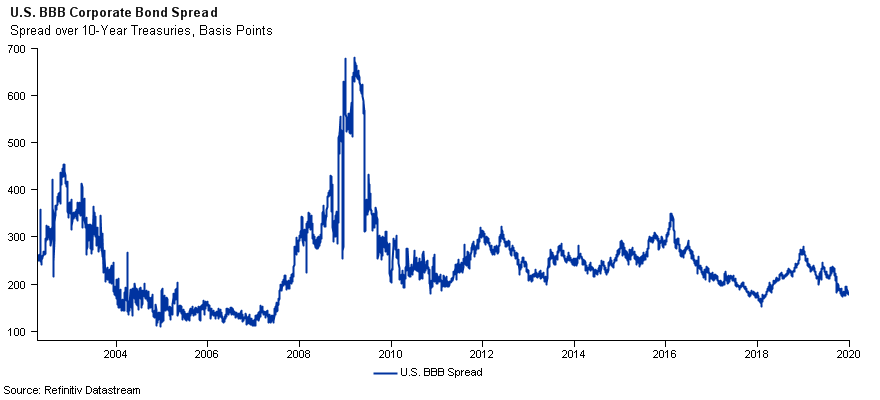 Figure 5
Despite the low yields for all bonds, investor appetite for income producing assets continues to be strong. Foreign demand for yield continues. There is still over $11 trillion in global bonds trading with negative yields making U.S. bonds look attractive to foreign investors even after hedging their currency risk. This strong demand, along with subdued inflation, make us think bond yields aren’t likely to test the highs seen in November 2018 anytime soon.
Investors need to be aware at these low yields, even a small increase in interest rates can lead to significant bond price declines. Despite the challenging environment, we continue to favor high quality intermediate term bonds, as we feel high quality bonds are an important way to diversify against the unexpected for our multi-asset portfolios.
The bottom line
In our view, the current economic expansion still has some legs and is unlikely to end in the near term. However, we feel U.S. stocks and bonds appear to be fully-priced. Charlie Munger, Buffet’s often-overshadowed colleague and vice chairman of Berkshire Hathaway, wrote, “… the wise ones bet heavily when the world offers them that opportunity. They bet big when they have the odds. And the rest of the time, they don’t. It’s just that simple.” Right now, we do not feel the odds are in our favor and are maintaining our neutral stance between stocks and bonds within multi-asset portfolios.
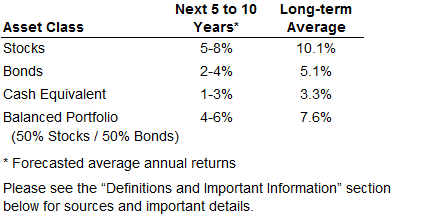 Figure 6
COUNTRY Trust Bank wealth management team
- Troy Frerichs, CFA - VP, Investment Services
- Kent Anderson, CFA - Portfolio Manager
- Jonathan Strok, CFA - Portfolio Manager
- Jamie Czesak - Investment Analyst
- Chelsie Moore, CFA, CFP® - Manager, Wealth Management
- Jeff Hank, CFA, CFP® - Portfolio Manager
- Weston Chenoweth - Investment Analyst
- Molly Ruddy - Investment Analyst
Looking for help navigating your future?
Set up a meeting with your local rep to review your current policies and make sure they're up to date. We pulled together some less obvious reasons to adjust your coverage.
COUNTRY Financial® is a family of affiliated companies (collectively, COUNTRY) located in Bloomington, IL. Learn more about who we are.
NOT FDIC-INSURED
May lose value
No bank guarantee
All information is as of the report date unless otherwise noted.
This material is provided for informational purposes only and should not be used or construed as investment advice or a recommendation of any security, sector, or investment strategy. All views expressed and forward-looking information, including forecasts and estimates, are based on the information available at the time of writing, do not provide a complete analysis of every material fact, and may change based on market or other conditions. Statements of fact are from sources considered reliable, but no representation or warranty is made as to their completeness or accuracy. Unless otherwise noted, the analysis and opinions provided are those of the COUNTRY Trust Bank investment team identified above and not necessarily those of COUNTRY Trust Bank or its affiliates.
Diversification, asset allocation and rebalancing do not assure a profit or guarantee against loss. All market indexes are unmanaged, and returns do not include fees and expenses associated with investing in securities. It is not possible to invest directly in an index.
Investment management, retirement, trust and planning services provided by COUNTRY Trust Bank®.
Past performance does not guarantee future results. All investing involves risk, including risk of loss.
Definitions and Important Information
1 Rudebusch, Glenn D., “Will the Economic Recovery Die of Old Age?”, Federal Reserve Bank of San Francisco Economic Letter 2016-03, February 4, 2016.
Figures 1,3,4,5: Chart data comes from Refinitiv (formerly Thomson Reuters) Datastream, a powerful platform that integrates top-down macroeconomic research and bottom-up fundamental analysis.
Figure 1: U.S. Large Cap Equities – S&P 500® Index, U.S. Small Cap Equities – Russell 2000® Index, U.S. Investment Grade Bonds – iShares Core US Aggregate Bond ETF, Developed International Equities – MSCI EAFE Index, Emerging Market Equities - MSCI Emerging Markets Index, Commodities – S&P GSCI Index
Figure 2: Chart data comes from the Federal Reserve Bank of St. Louis FRED economic database and the National Bureau of Economic Research.
Figure 6: The long-term average return data comes from Morningstar and is based upon compound average annual returns for the period from 1926 through December 31, 2019. Stocks are represented by the Ibbotson® Large Company Stock Index, which is comprised of the S&P 500® Composite Index from 1957 to present, and the S&P 90® Index from 1926 to 1956. Bonds are represented by the Ibbotson® U.S. Intermediate-Term Government Bond Index. Cash Equivalents are represented by the 30-day U.S. Treasury bill. The “Balanced Portfolio” is representative of an investment of 50% stocks and 50% bonds rebalanced annually. Forecasted stock returns include small capitalization and international equities. Forecasted bond returns include investment grade corporate bonds. These returns are for illustrative purposes and not indicative of actual portfolio performance. It is not possible to invest directly in an index.
The S&P 500® Index is an unmanaged index consisting of 500 large-cap U.S. stocks. Since it includes a significant portion of the total value of the market, it also considered representative of the market. The index does not reflect investment management fees, brokerage commission and other expenses associated with investing in equity securities. It is not possible to invest directly in an index.
The Russell 2000® Index measures the performance of the small-cap segment of the U.S. equity universe. The Russell 2000 Index is a subset of the Russell 3000® Index representing approximately 10% of the total market capitalization of that index. It includes approximately 2000 of the smallest securities based on a combination of their market cap and current index membership. The Russell 2000 is constructed to provide a comprehensive and unbiased small-cap barometer and is completely reconstituted annually to ensure larger stocks do not distort the performance and characteristics of the true small-cap opportunity set. The Index does not reflect investment management fees, brokerage commission and other expenses associated with investing in equity securities. It is not possible to invest directly in an index.
The iShares Core U.S. Aggregate Bond ETF seeks to track the investment results of the Bloomberg Barclays US Aggregate Bond Index. The Bloomberg Barclays US Aggregate Bond Index is a broad base, market capitalization-weighted bond market index representing intermediate term investment grade bonds traded in the United States.
The MSCI EAFE Index is broadly recognized as the pre-eminent benchmark for U.S. investors to measure international equity performance. It comprises the MSCI country indexes capturing large and mid-cap equities across developed markets in Europe, Australasia and the Far East, excluding the U.S. and Canada.
The MSCI Emerging Markets Index captures large and mid-cap representation across 26 emerging market countries. The index free float-adjusted market capitalization index and represents 13% of global market capitalization.
The S&P GSCI is a widely recognized benchmark that is broad-based and production weighted to represent the global commodity market beta. The index includes the most liquid commodity futures.
Brent Crude Oil is a trading classification of sweet light crude oil that serves as a major benchmark price for purchases of oil worldwide. Brent is the leading global price benchmark for Atlantic basin crude oils. It is used to price approximately two thirds of the world’s internationally traded crude oil supplies.
The J.P. Morgan U.S. Liquid Index is an unmanaged market-weighted index composed of the most liquid issues in the investment grade, U.S. dollar-denominated corporate bond market.
The federal funds rate is the interest rate at which depository institutions lend reserve balances to other depository institutions overnight. The Federal Open Market Committee, which is the primary monetary policymaking body of the Federal Reserve, sets its desired target range.
The yield curve plots the interest rates of similar-quality bonds against their maturities. The most common yield curve plots the yields of U.S. Treasury securities for various maturities. An inverted yield curve occurs when short-term rates are higher than long-term rates.
The price-to-earnings ratio is a valuation ratio which compares a company's current share price with its earnings per share (EPS). EPS is usually from the last four quarters (trailing P/E), but sometimes it can be derived from the estimates of earnings expected in the next four quarters (projected or forward P/E). The ratio is also sometimes known as "price multiple" or "earnings multiple."
Stocks of small-capitalization companies involve substantial risk. These stocks historically have experienced greater price volatility than stocks of larger companies, and they may be expected to do so in the future.
Stocks of mid-capitalization companies may be slightly less volatile than those of small-capitalization companies but still involve substantial risk and they may be subject to more abrupt or erratic movements than large capitalization companies.
International investing involves risks not typically associated with domestic investing, including risks of adverse currency fluctuations, potential political and economic instability, different accounting standards, limited liquidity and volatile prices.
Fixed income securities are subject to various risks, including changes in interest rates, credit quality, market valuations, liquidity, prepayments, early redemption, corporate events, tax ramifications and other factors. Debt securities typically decrease in value when interest rates rise. The risk is usually greater for longer-term debt securities. Investments in lower-rated and nonrated securities present a greater risk of loss to principal and interest than higher-rated securities.
Sector investments tend to be more volatile than investments that diversify across companies in many sectors.